Usage and snapshots
Graphical User Interface (GUI)
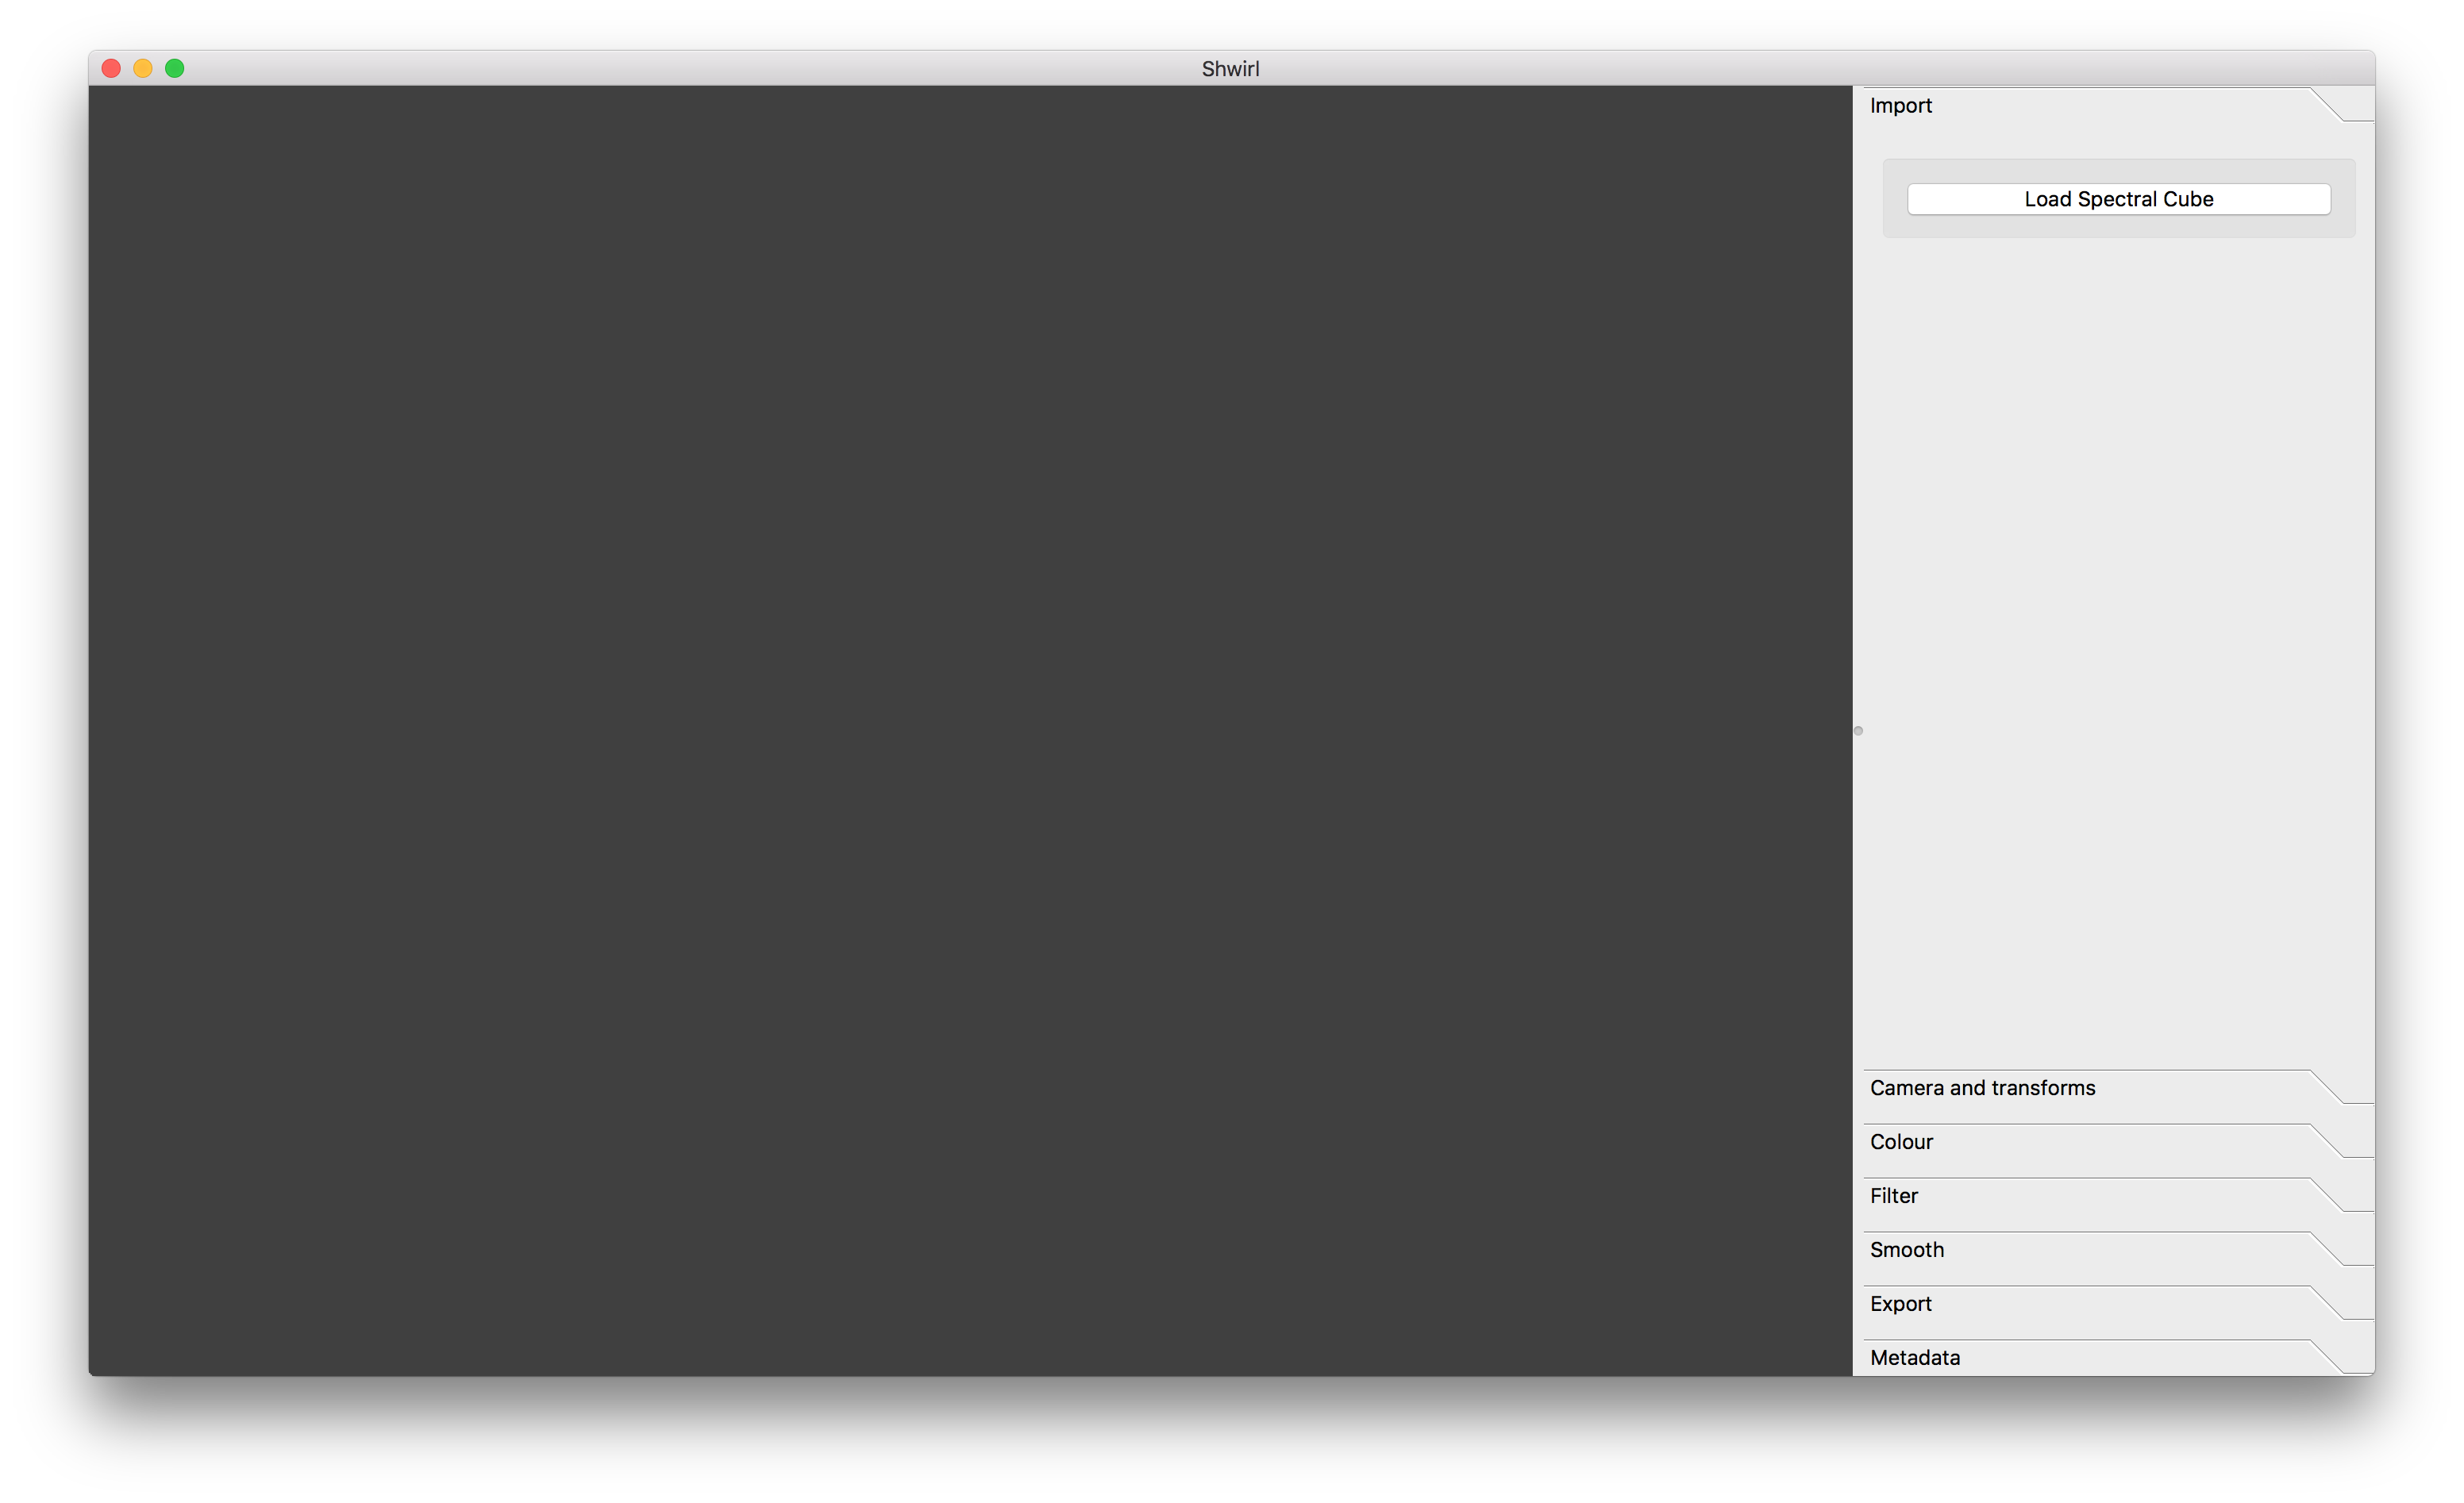
Upon start of the software, you will need to open a new spectral cube (currently supports FITS 3D image files only) using the GUI by clicking the Load Spectral Cube button at the top right corner.
Visualisation and colour bar
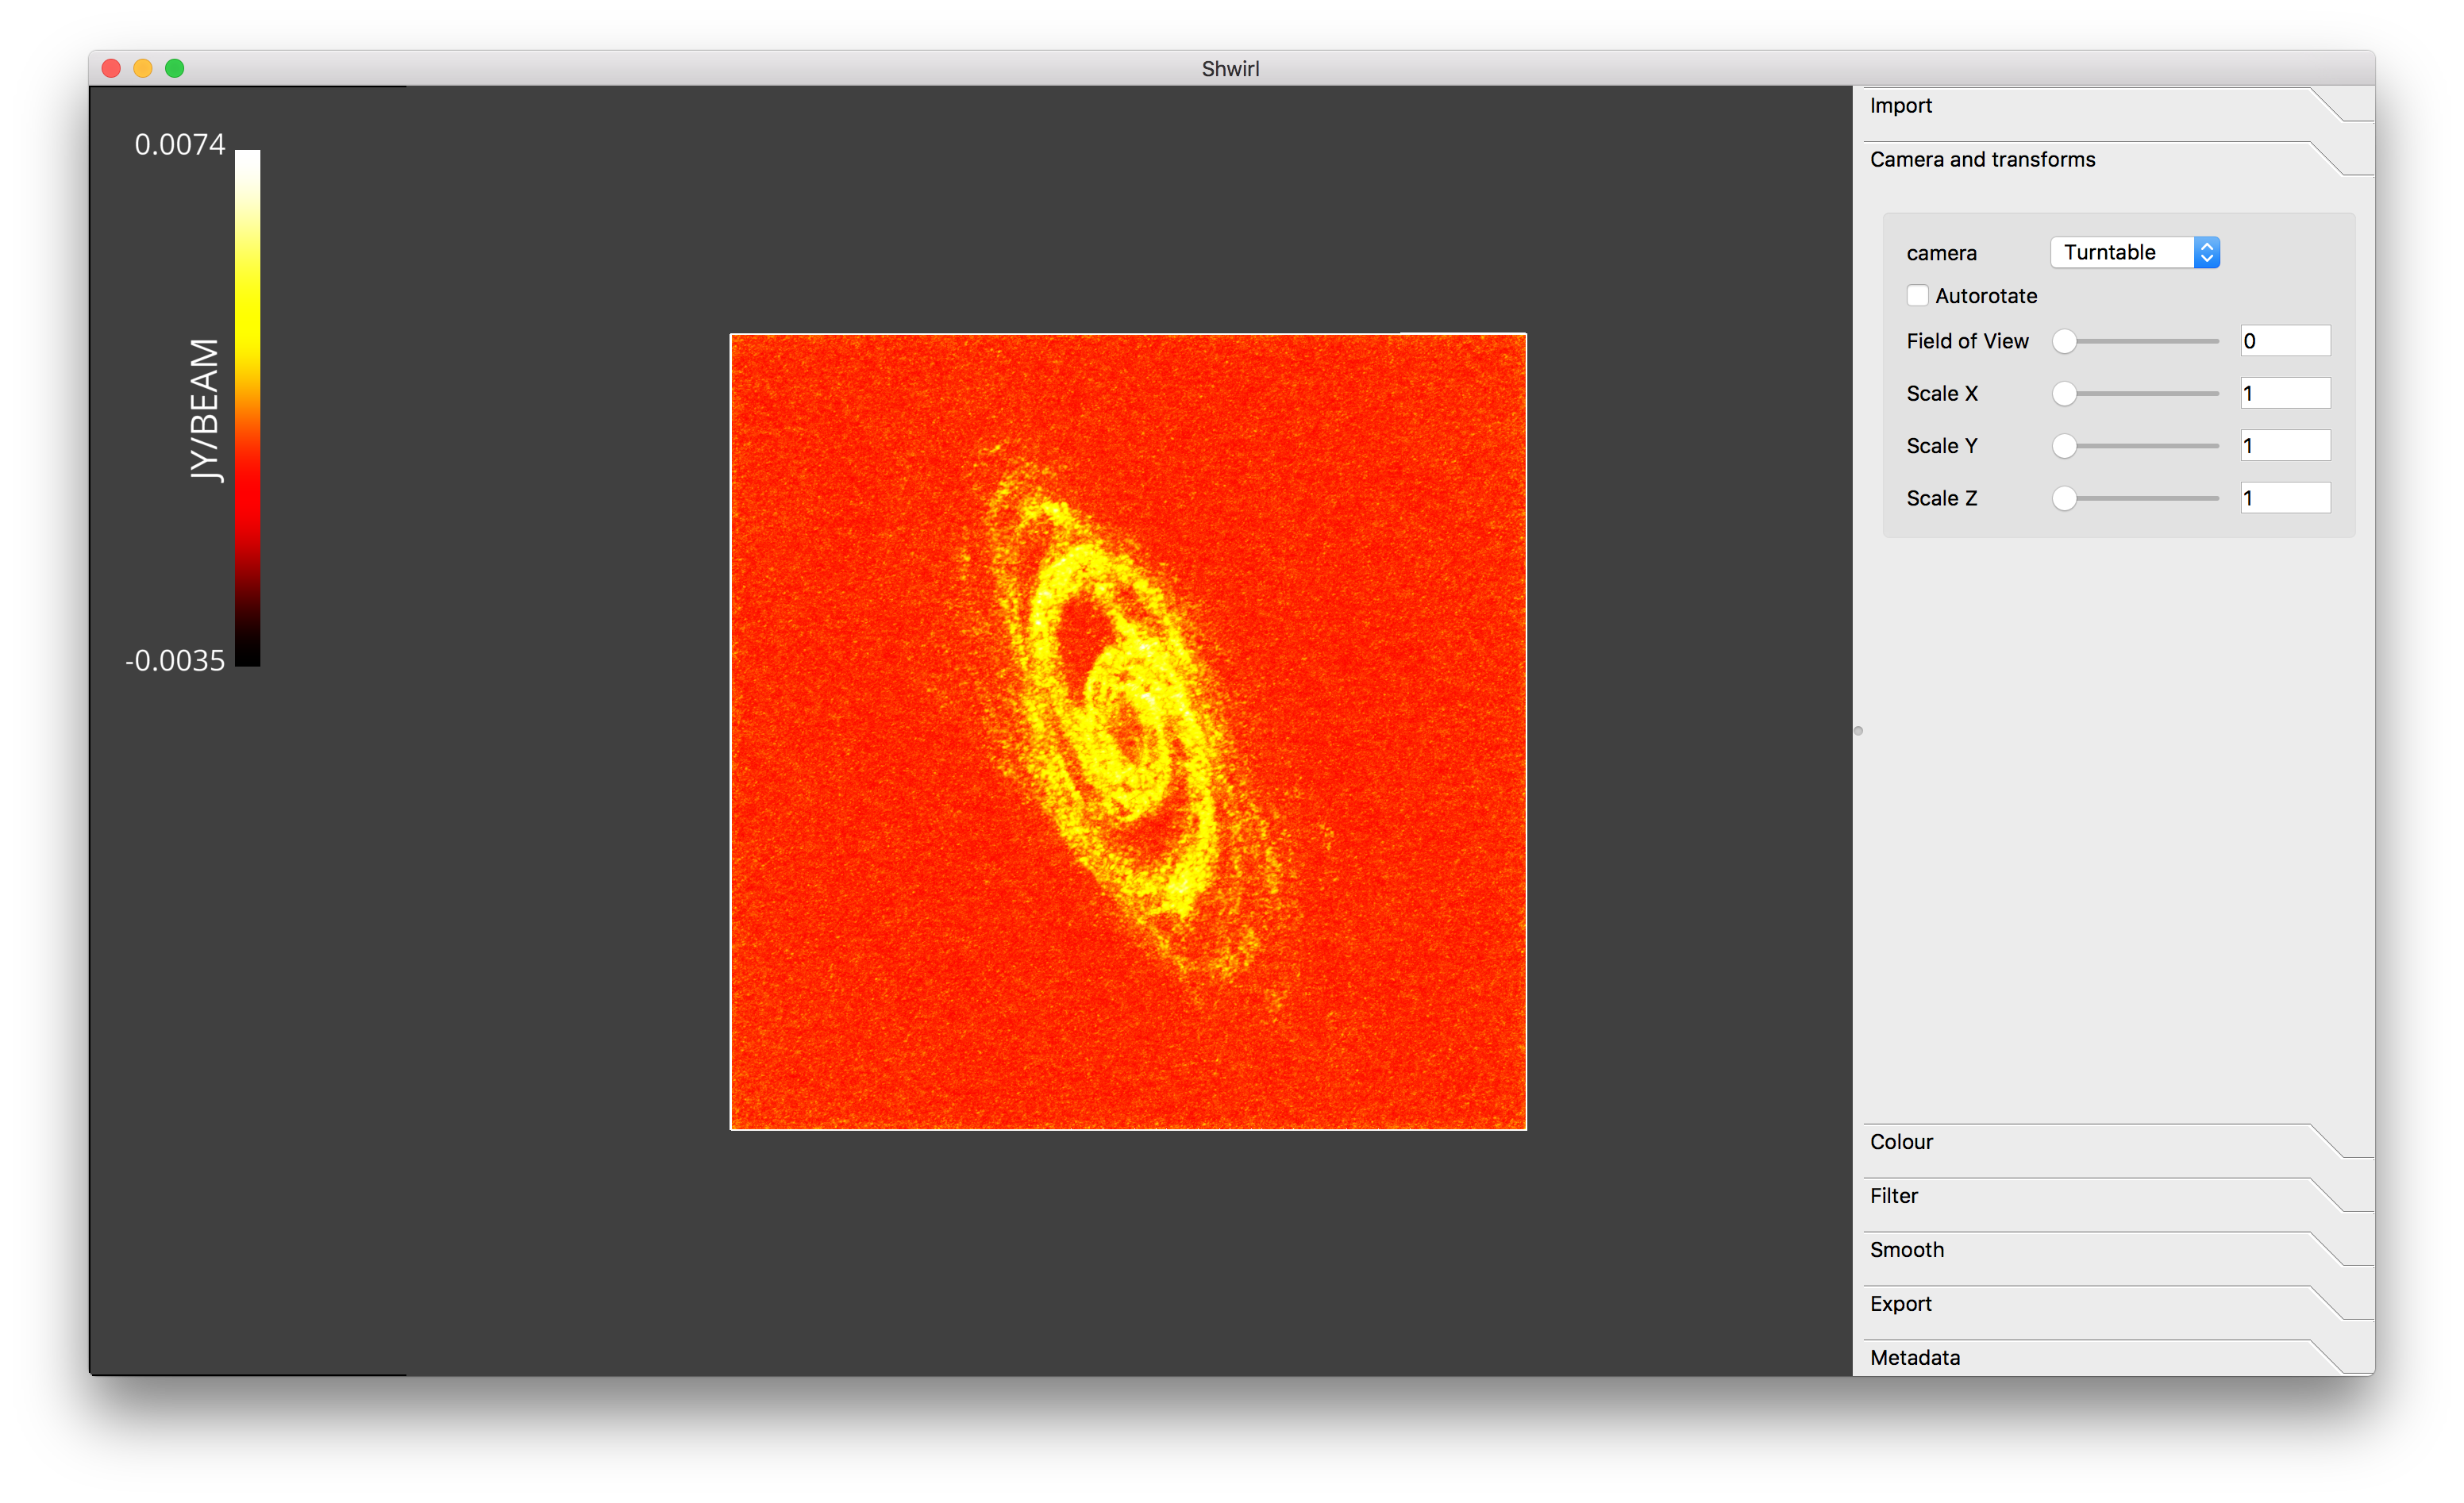
Once you have successfully loaded a spectral cube, the 3D volume can be rotated, panned and zoomed using a mouse or a trackpad. To rotate the cube, simply click and move. Panning can be achieved by click-n-move while pressing the shift key. Zooming in and out is achieved using the wheel, or using trackpad interactions like using two fingers (depending on device).
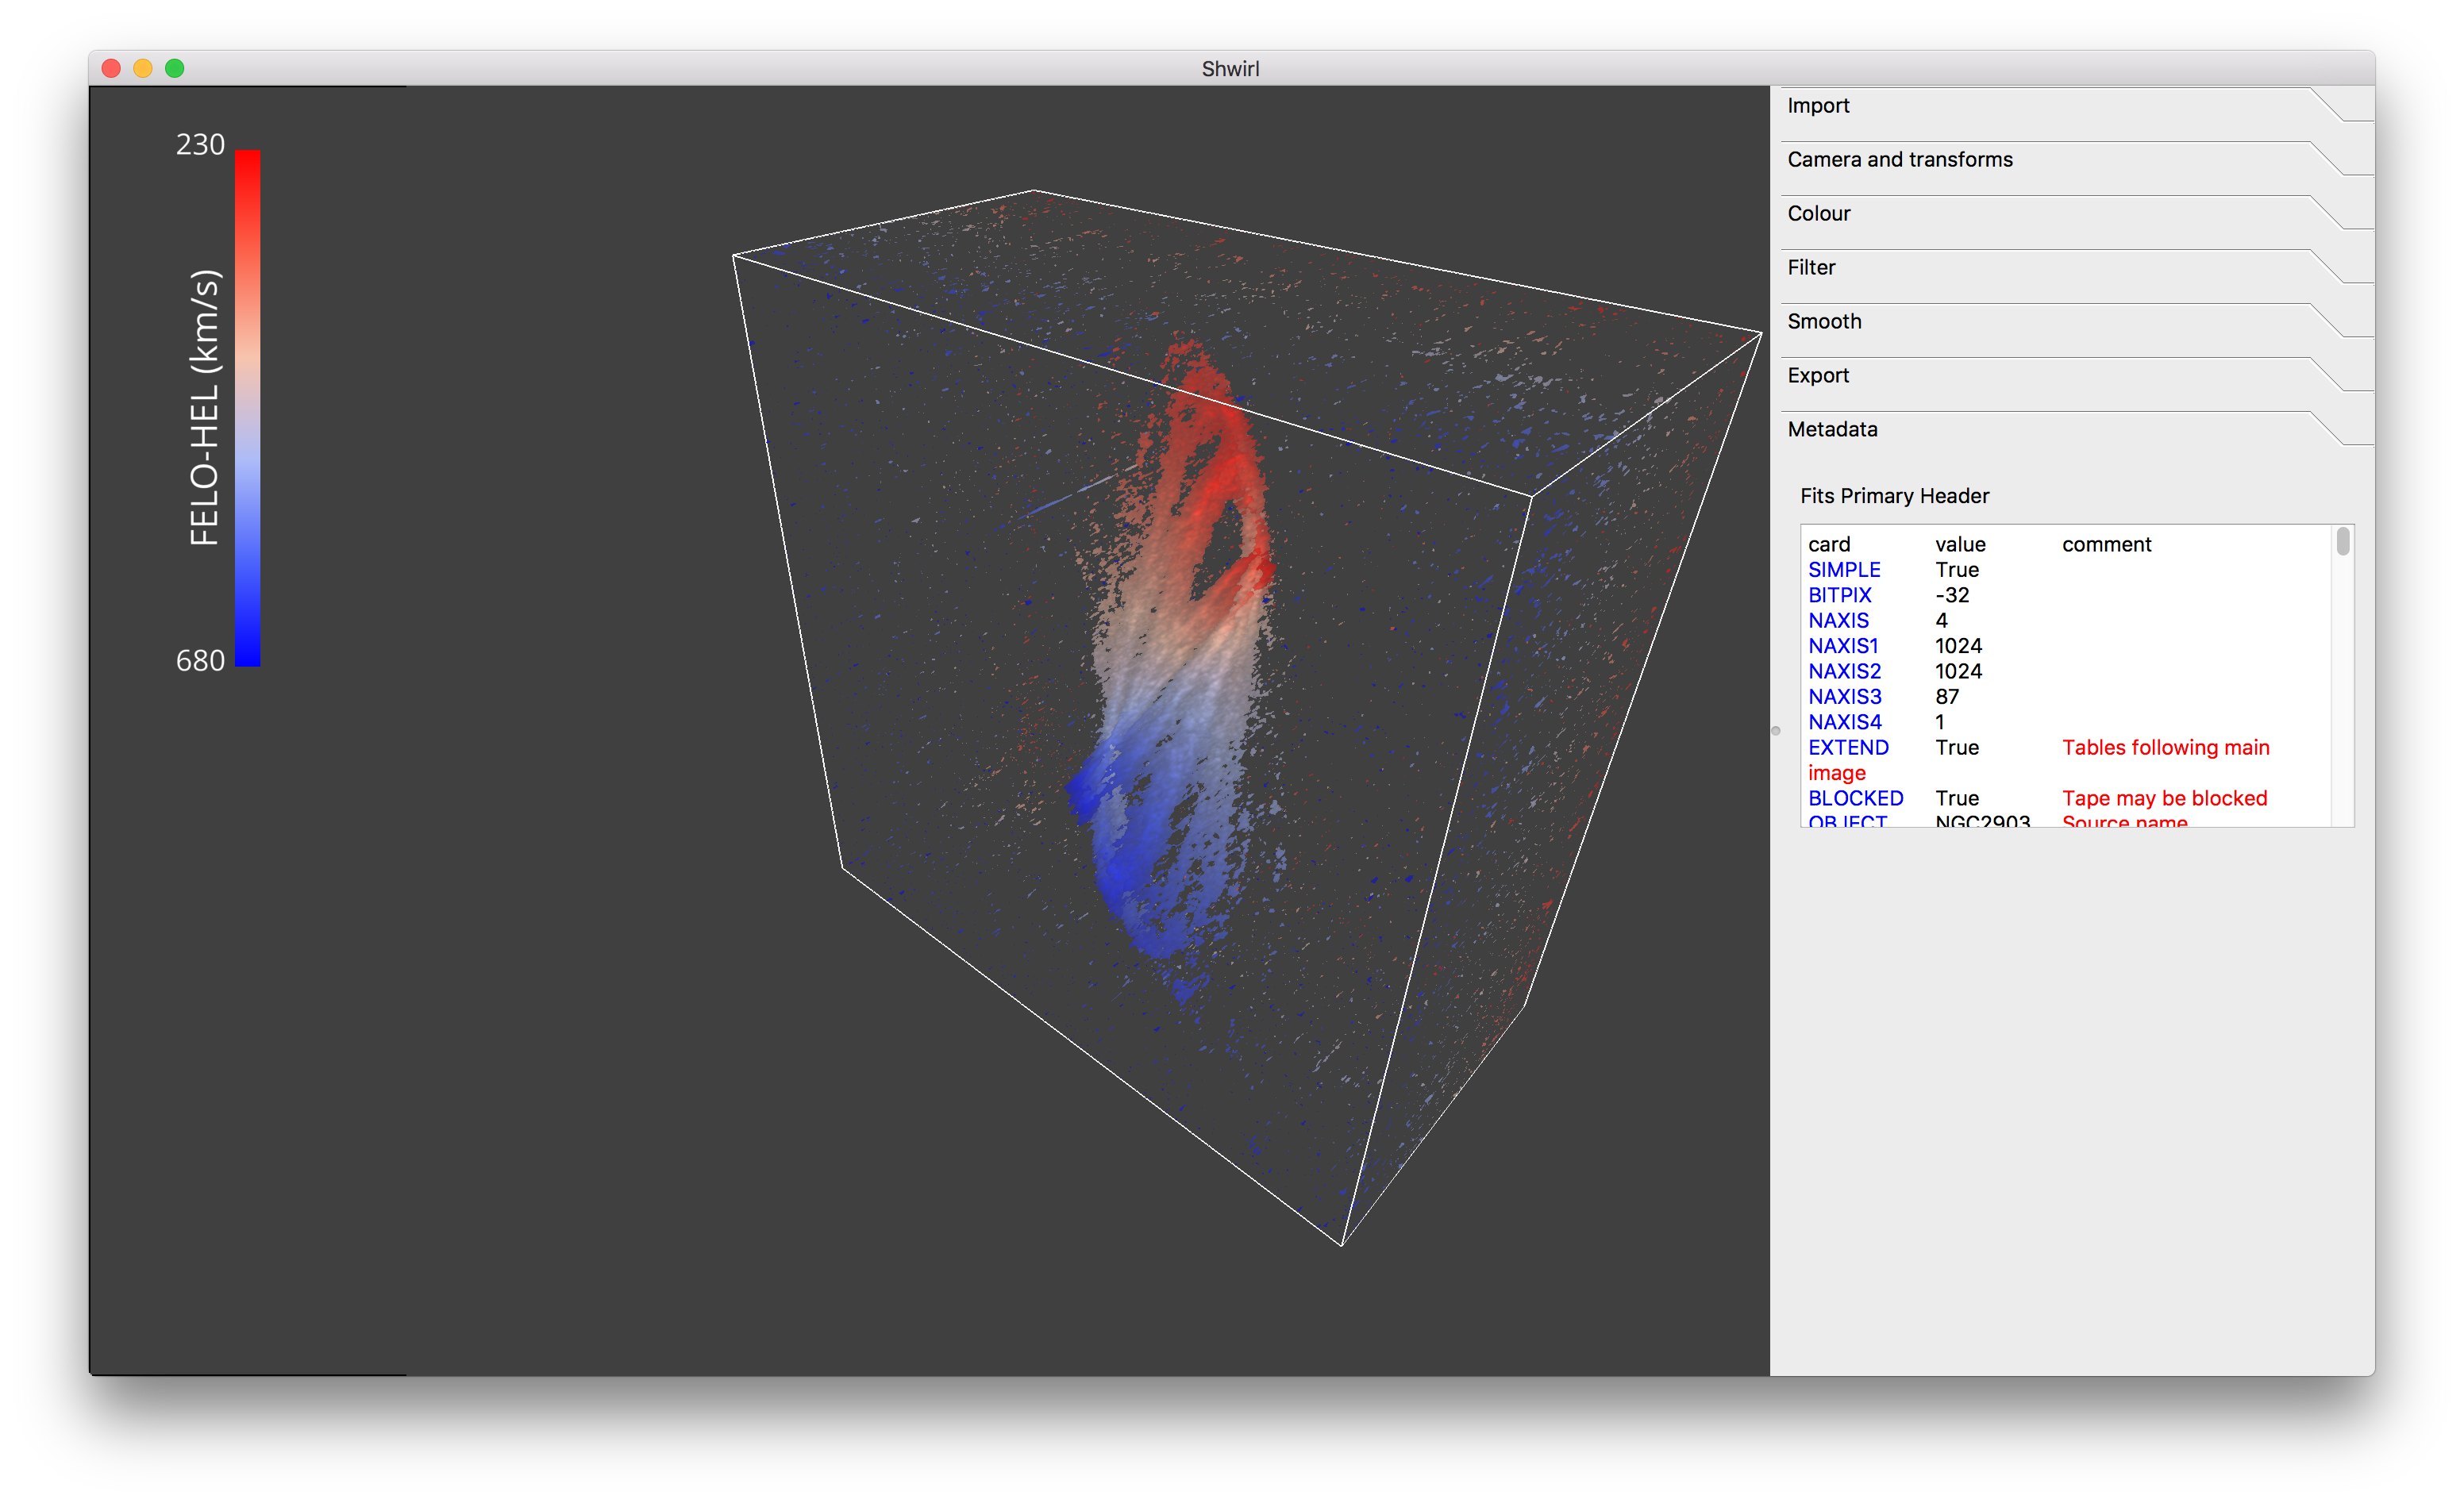
The colour bar information is based on the FITS header and will vary depending on the colouring method. If you find any oddities, please let me know.
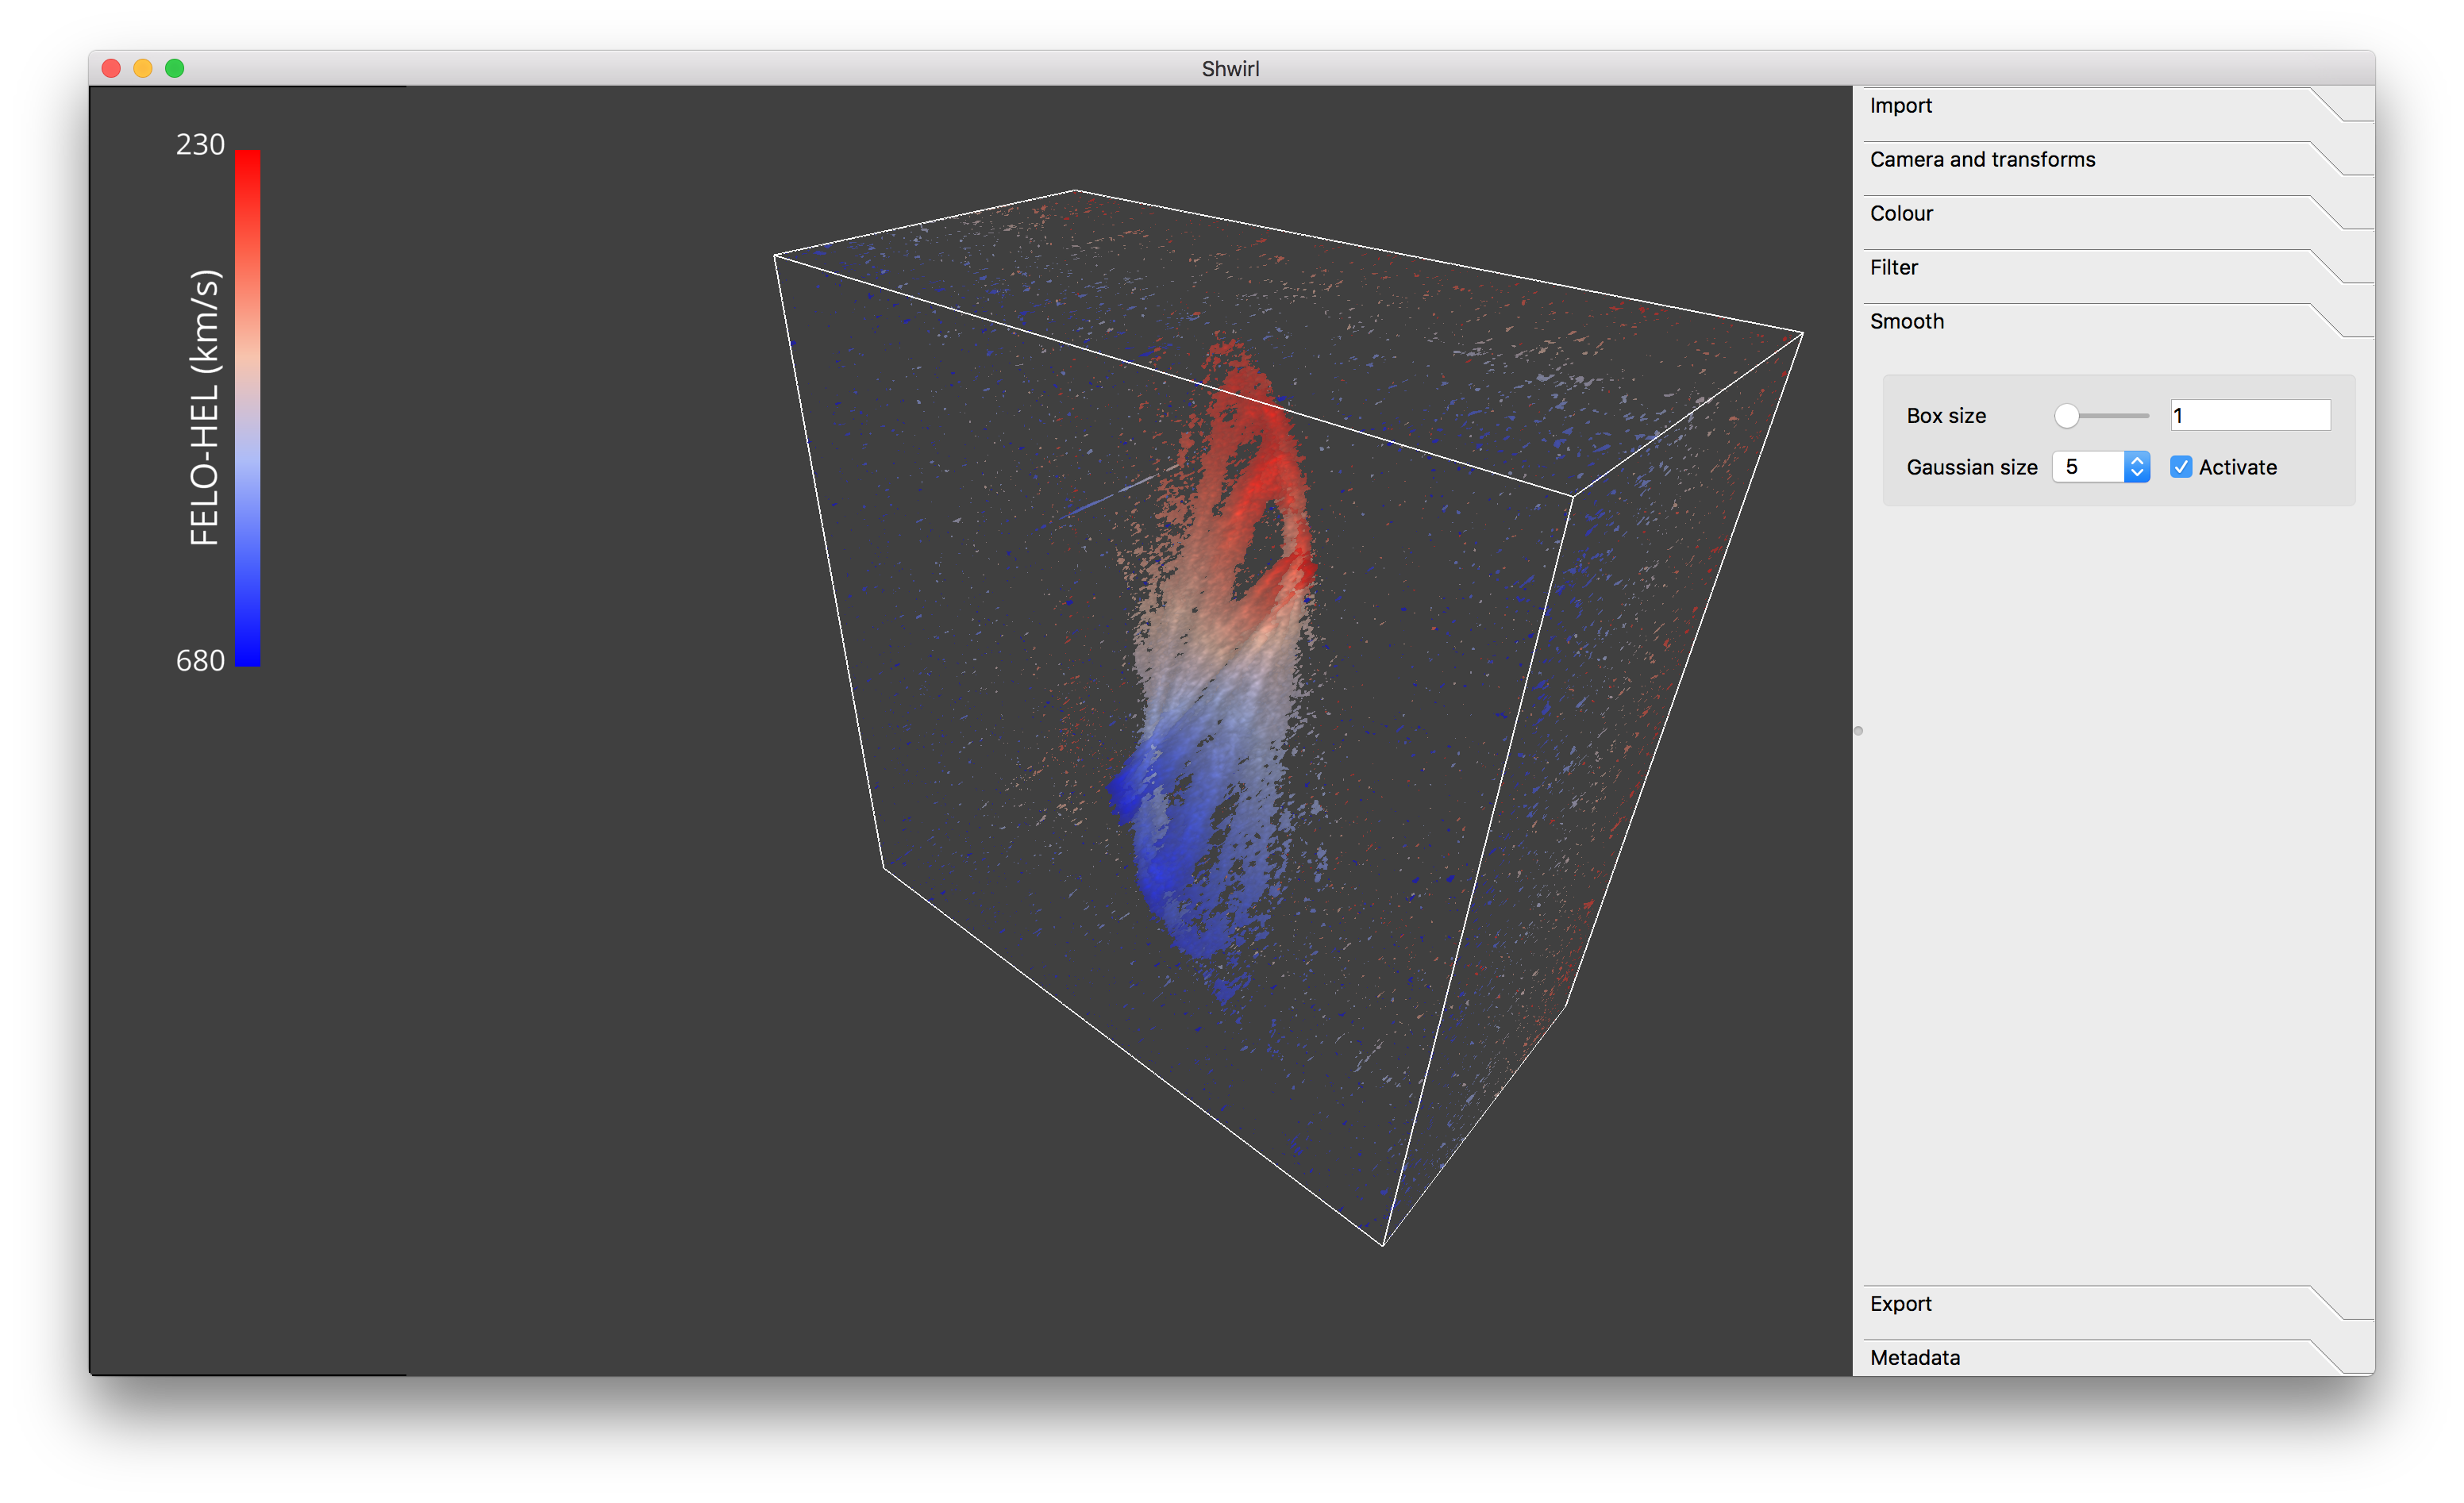
Widgets
The widgets can be used to interact and modify the visualisation outcome. Usage is straight forward: click, slide, select. See what happens!
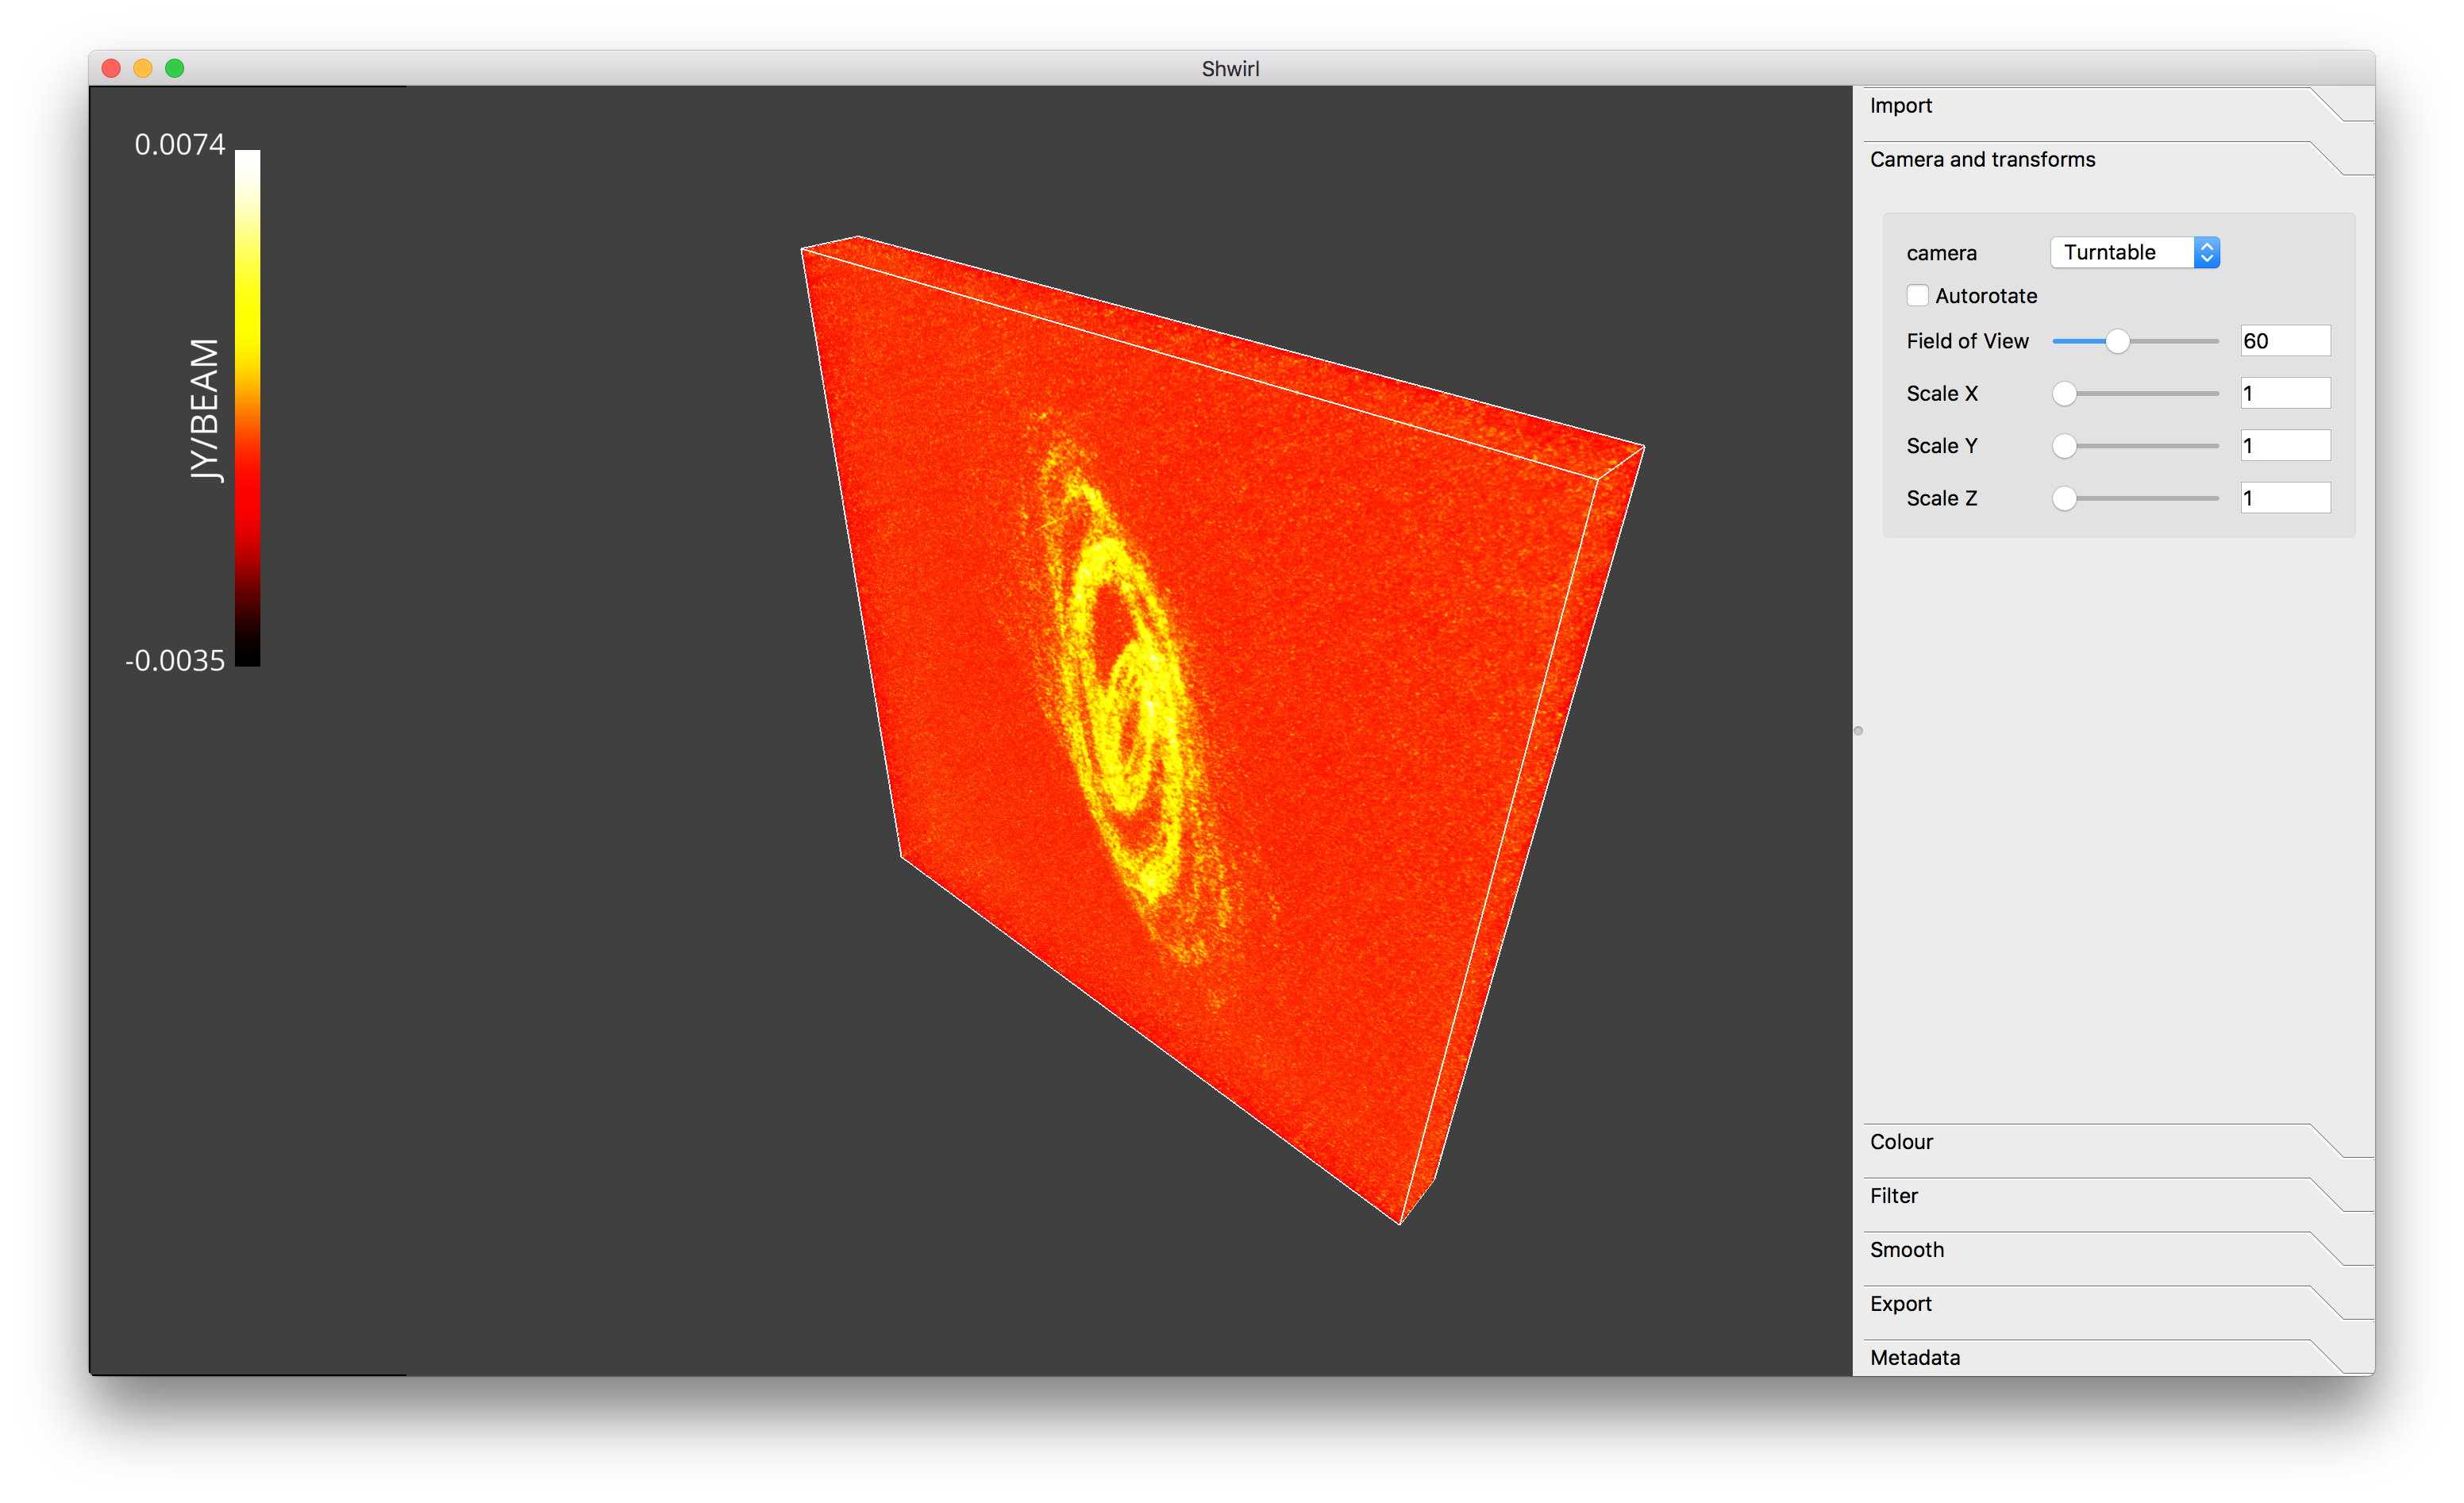
Cameras and transform
You can set the field of view of the camera:
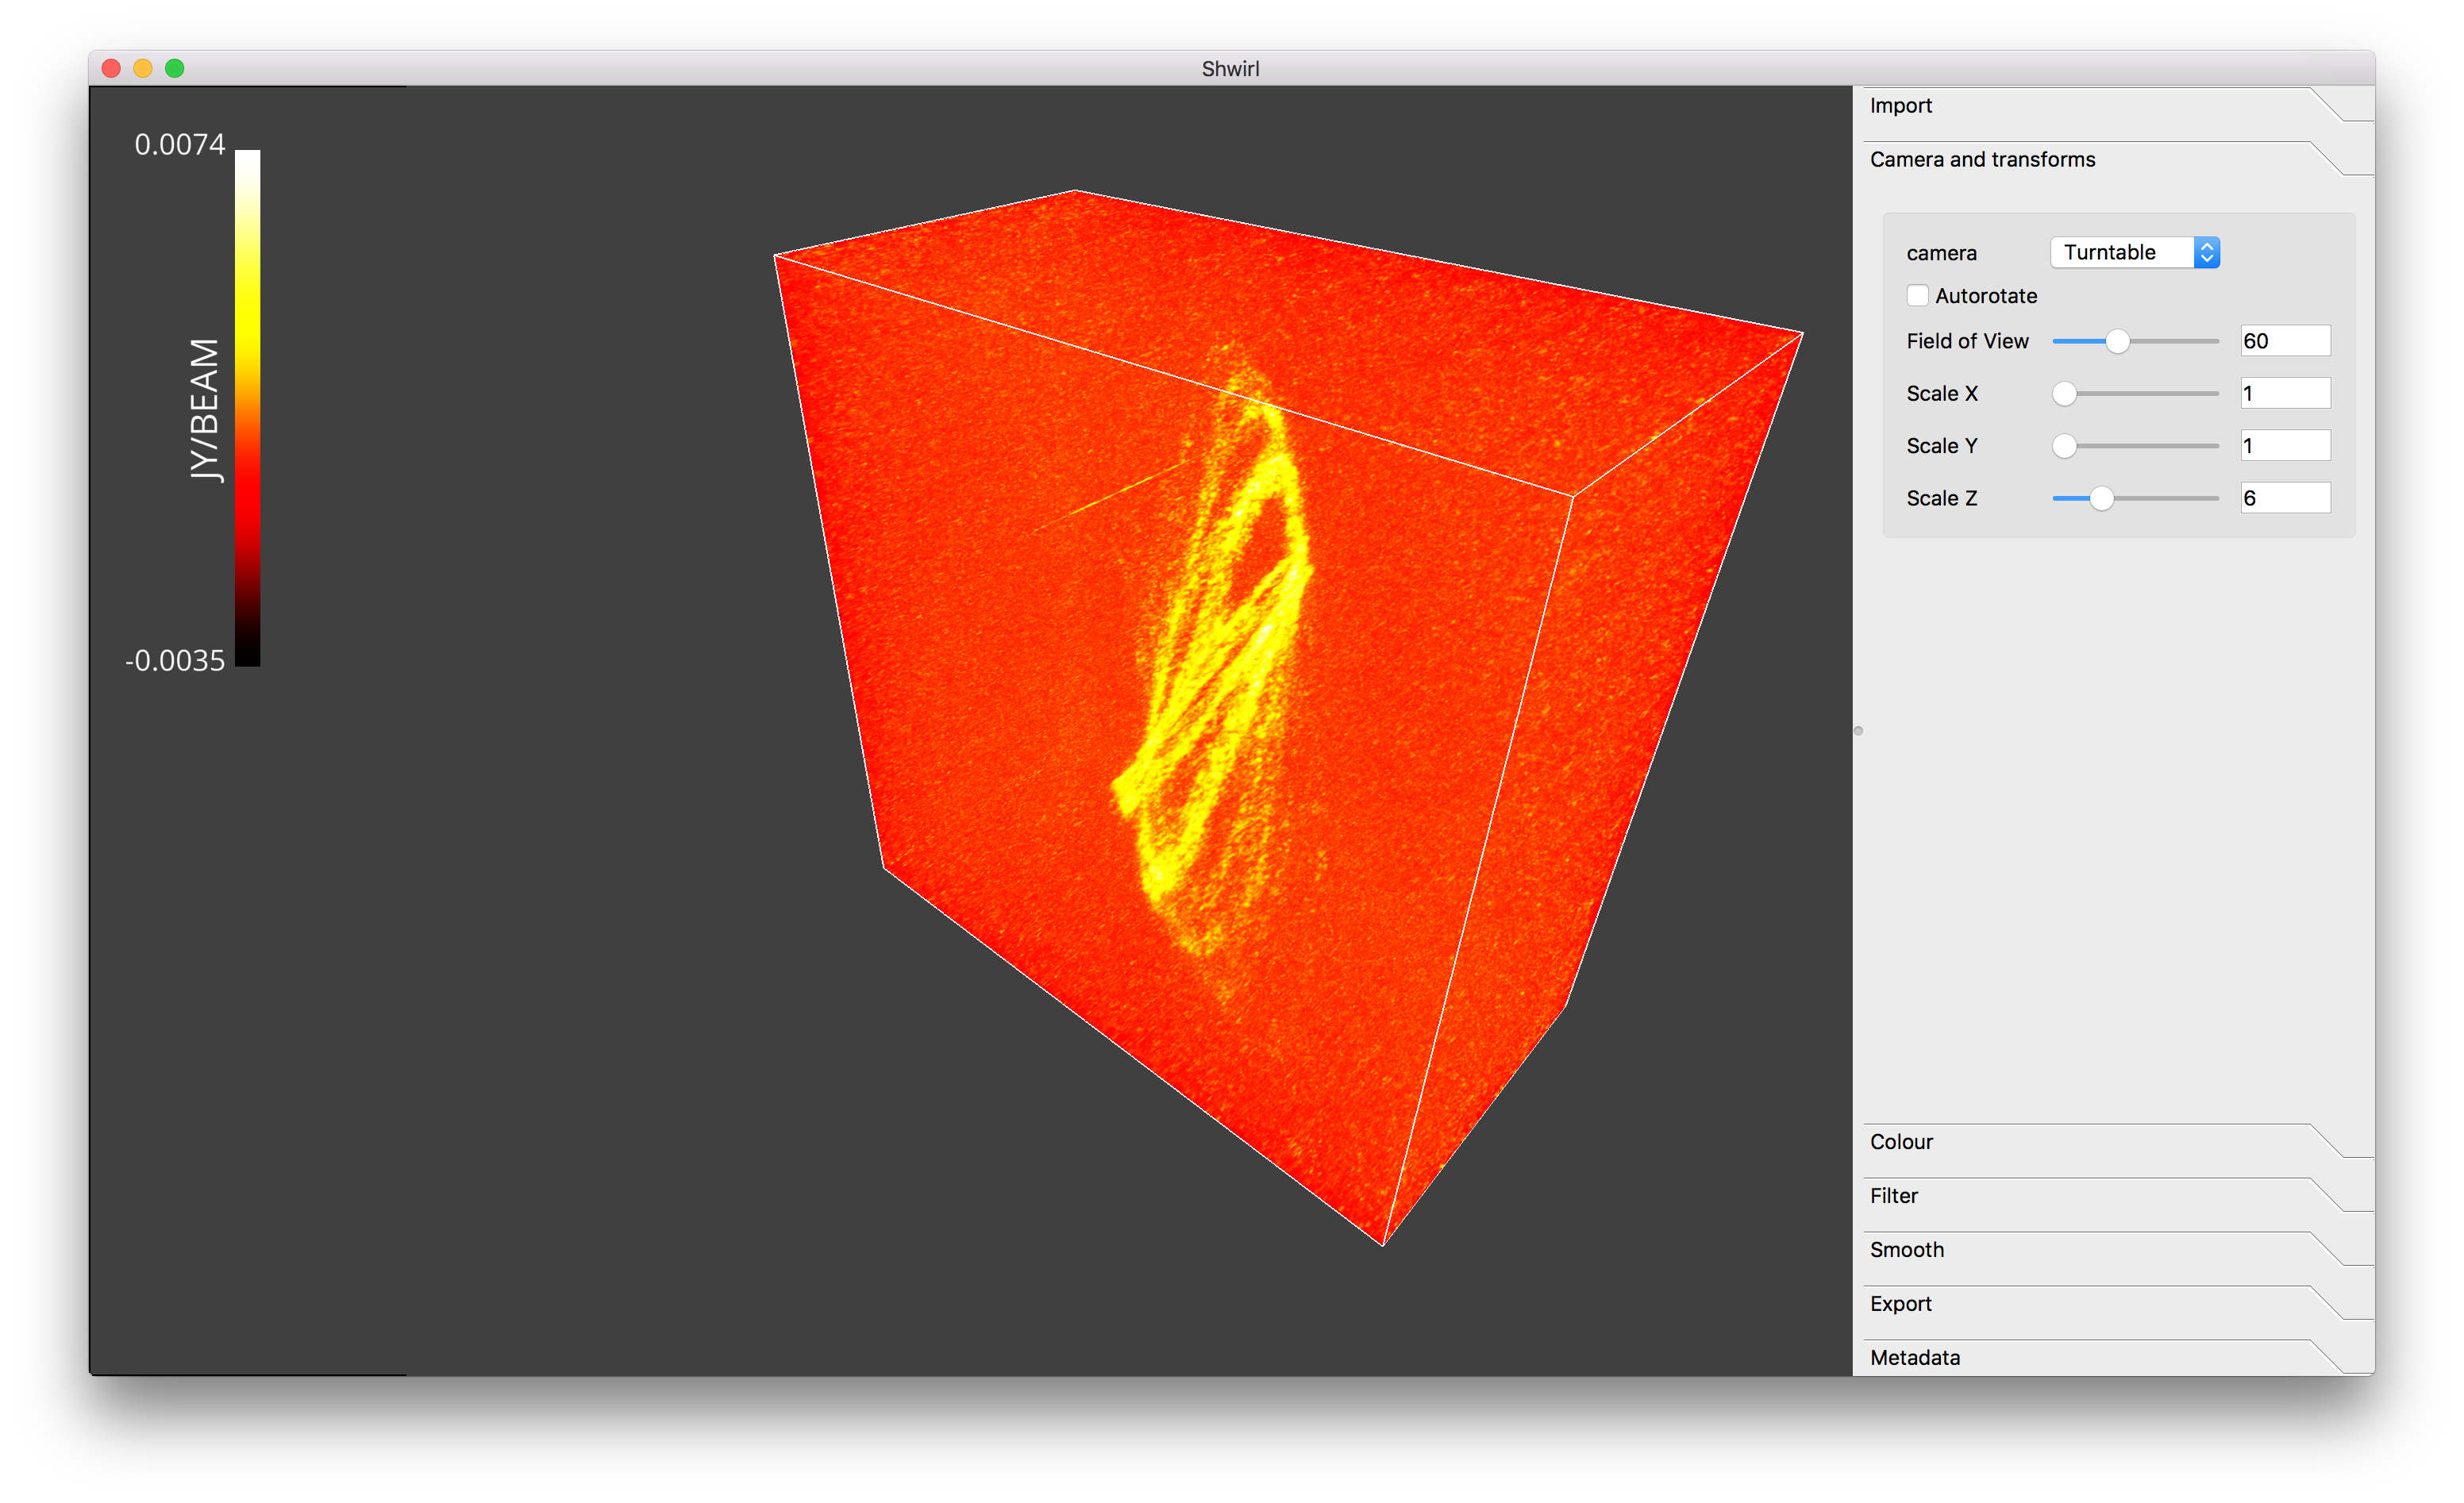
You can scale axes (e.g. if the spectral axis does not have as many elements as the spatial axes):
Other options include:
- Choice of different cameras (VisPy’s cameras)
- Turntable (Default)
- Argball
- Fly (using keyboard’s arrows)
- Autorotate
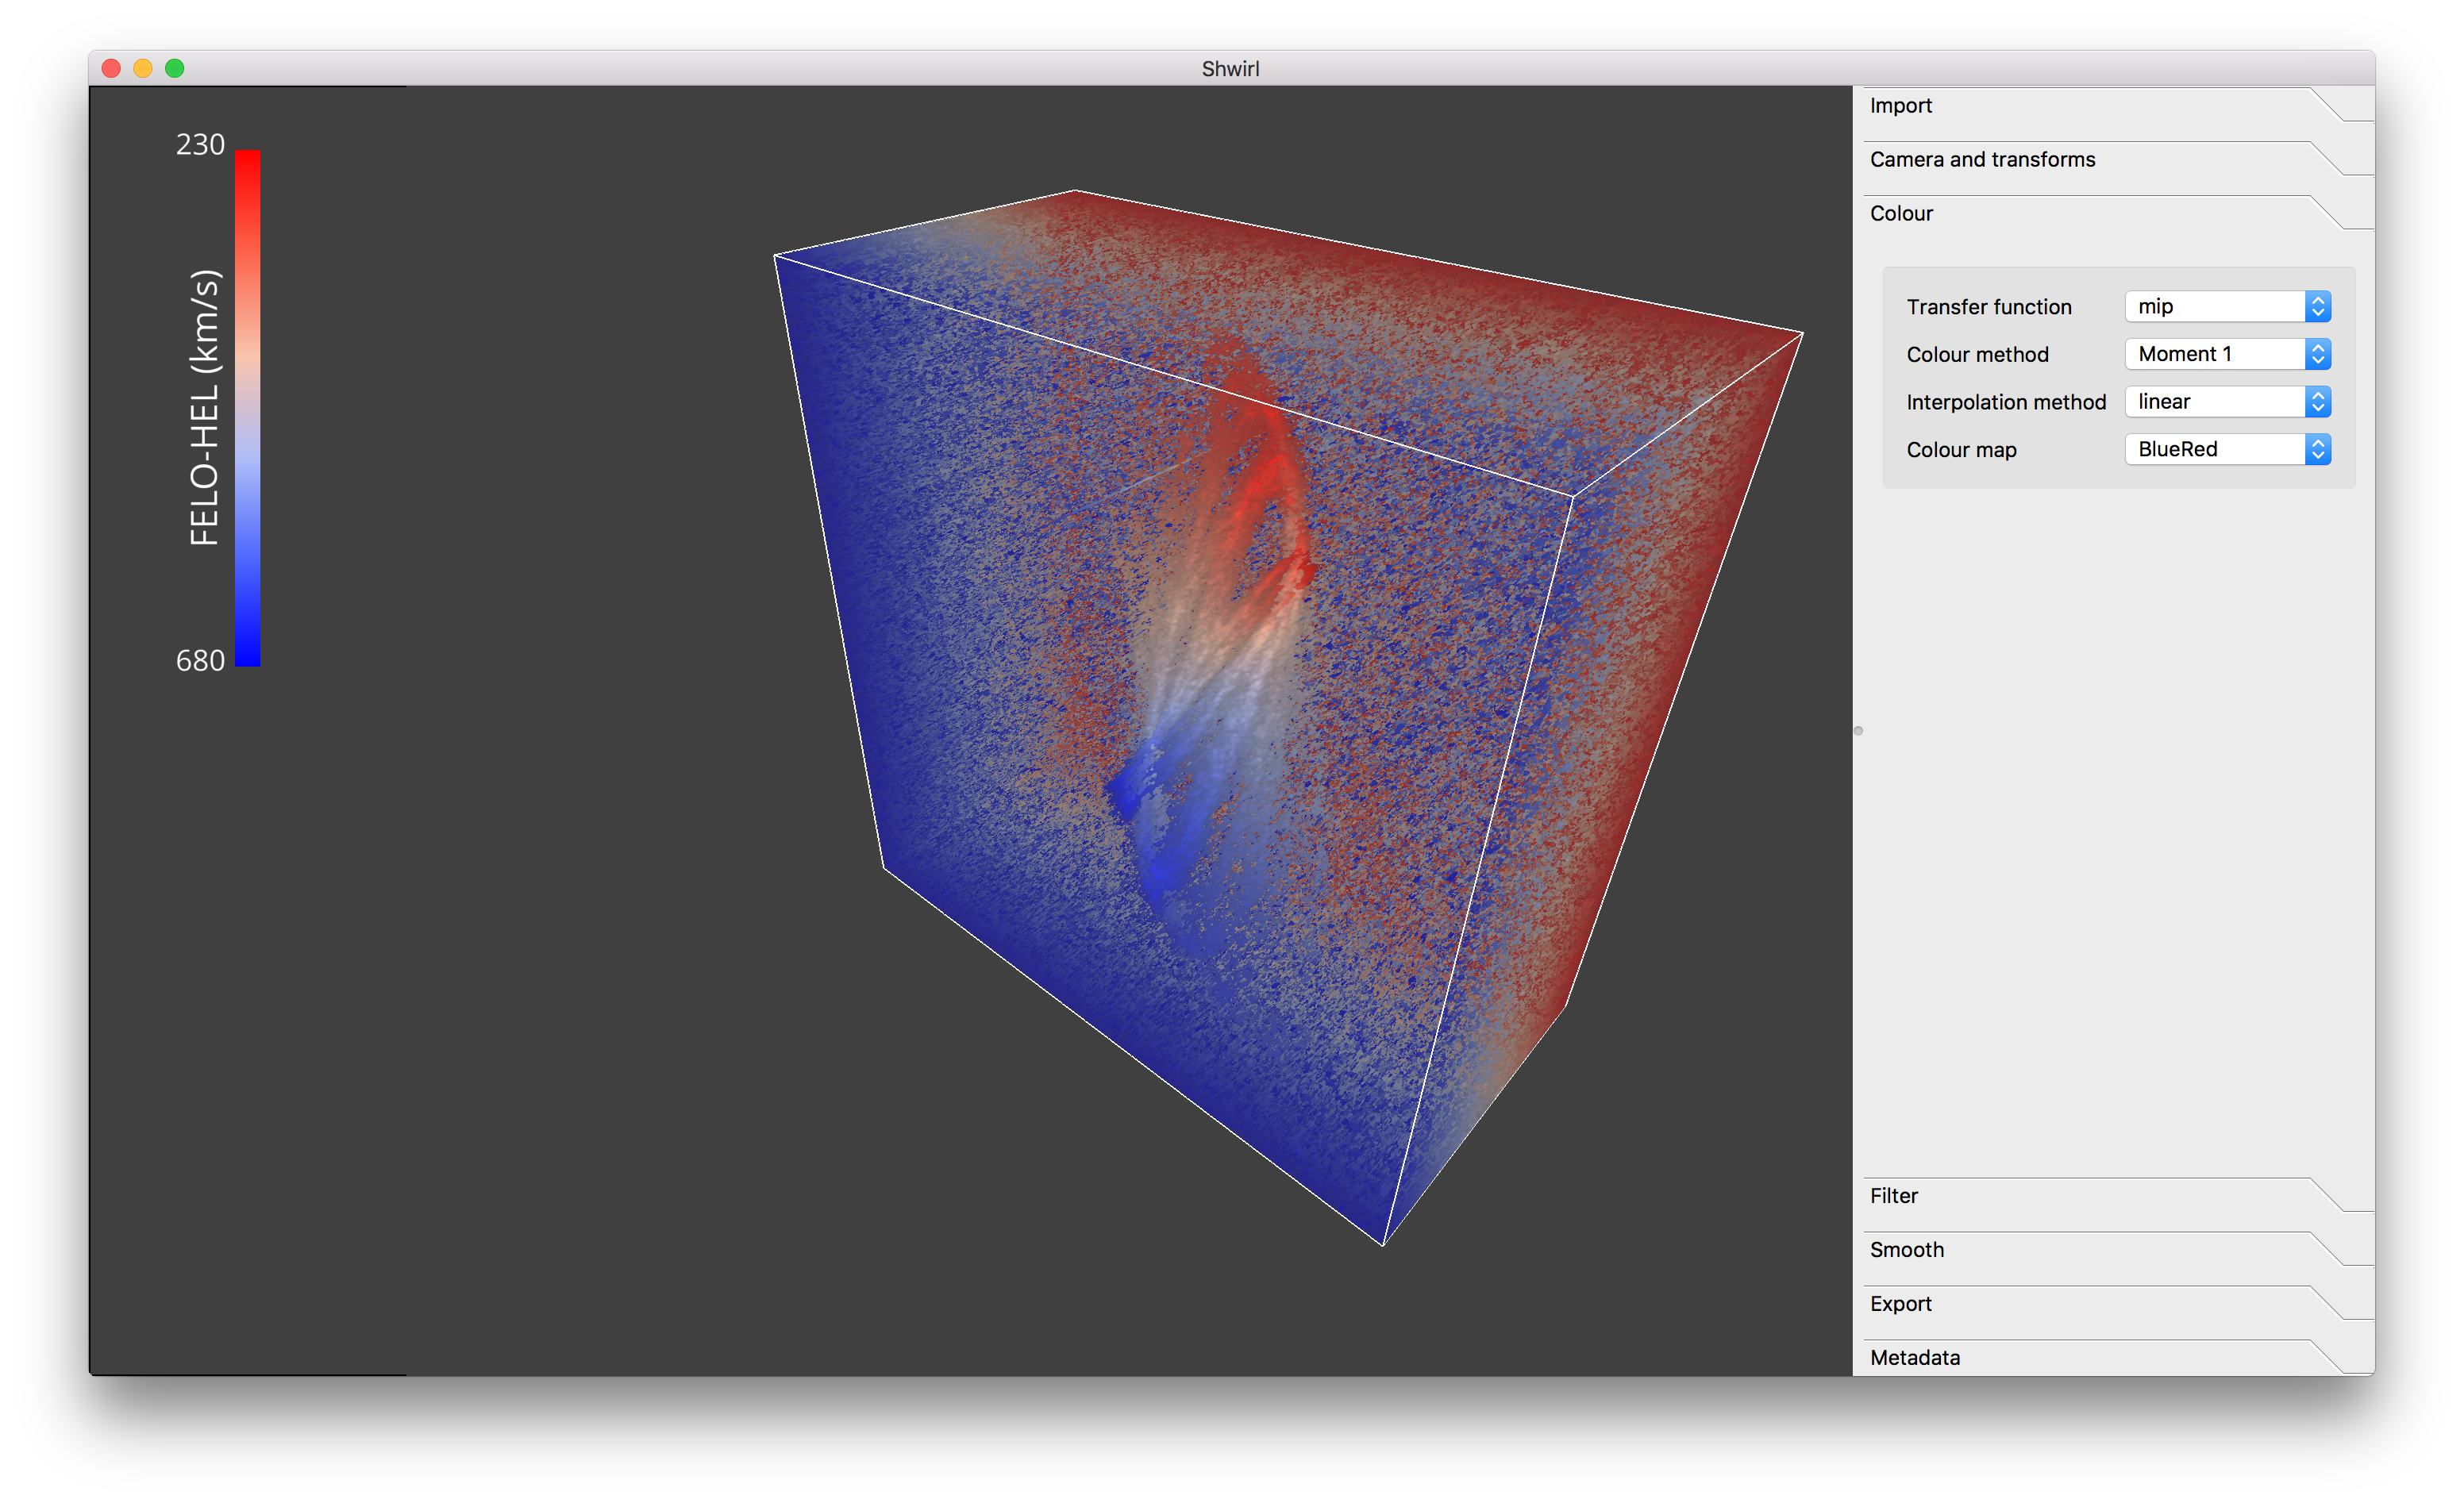
Colour
Shwirl includes different transfer functions and colouring methods.
Transfer functions
- Maximum Intensity Projection (MIP)
- Local Maximum Intensity Projection (LMIP)
- Accumulated Voxel Intensity Projection (AVIP)
- Iso surface
Colouring methods
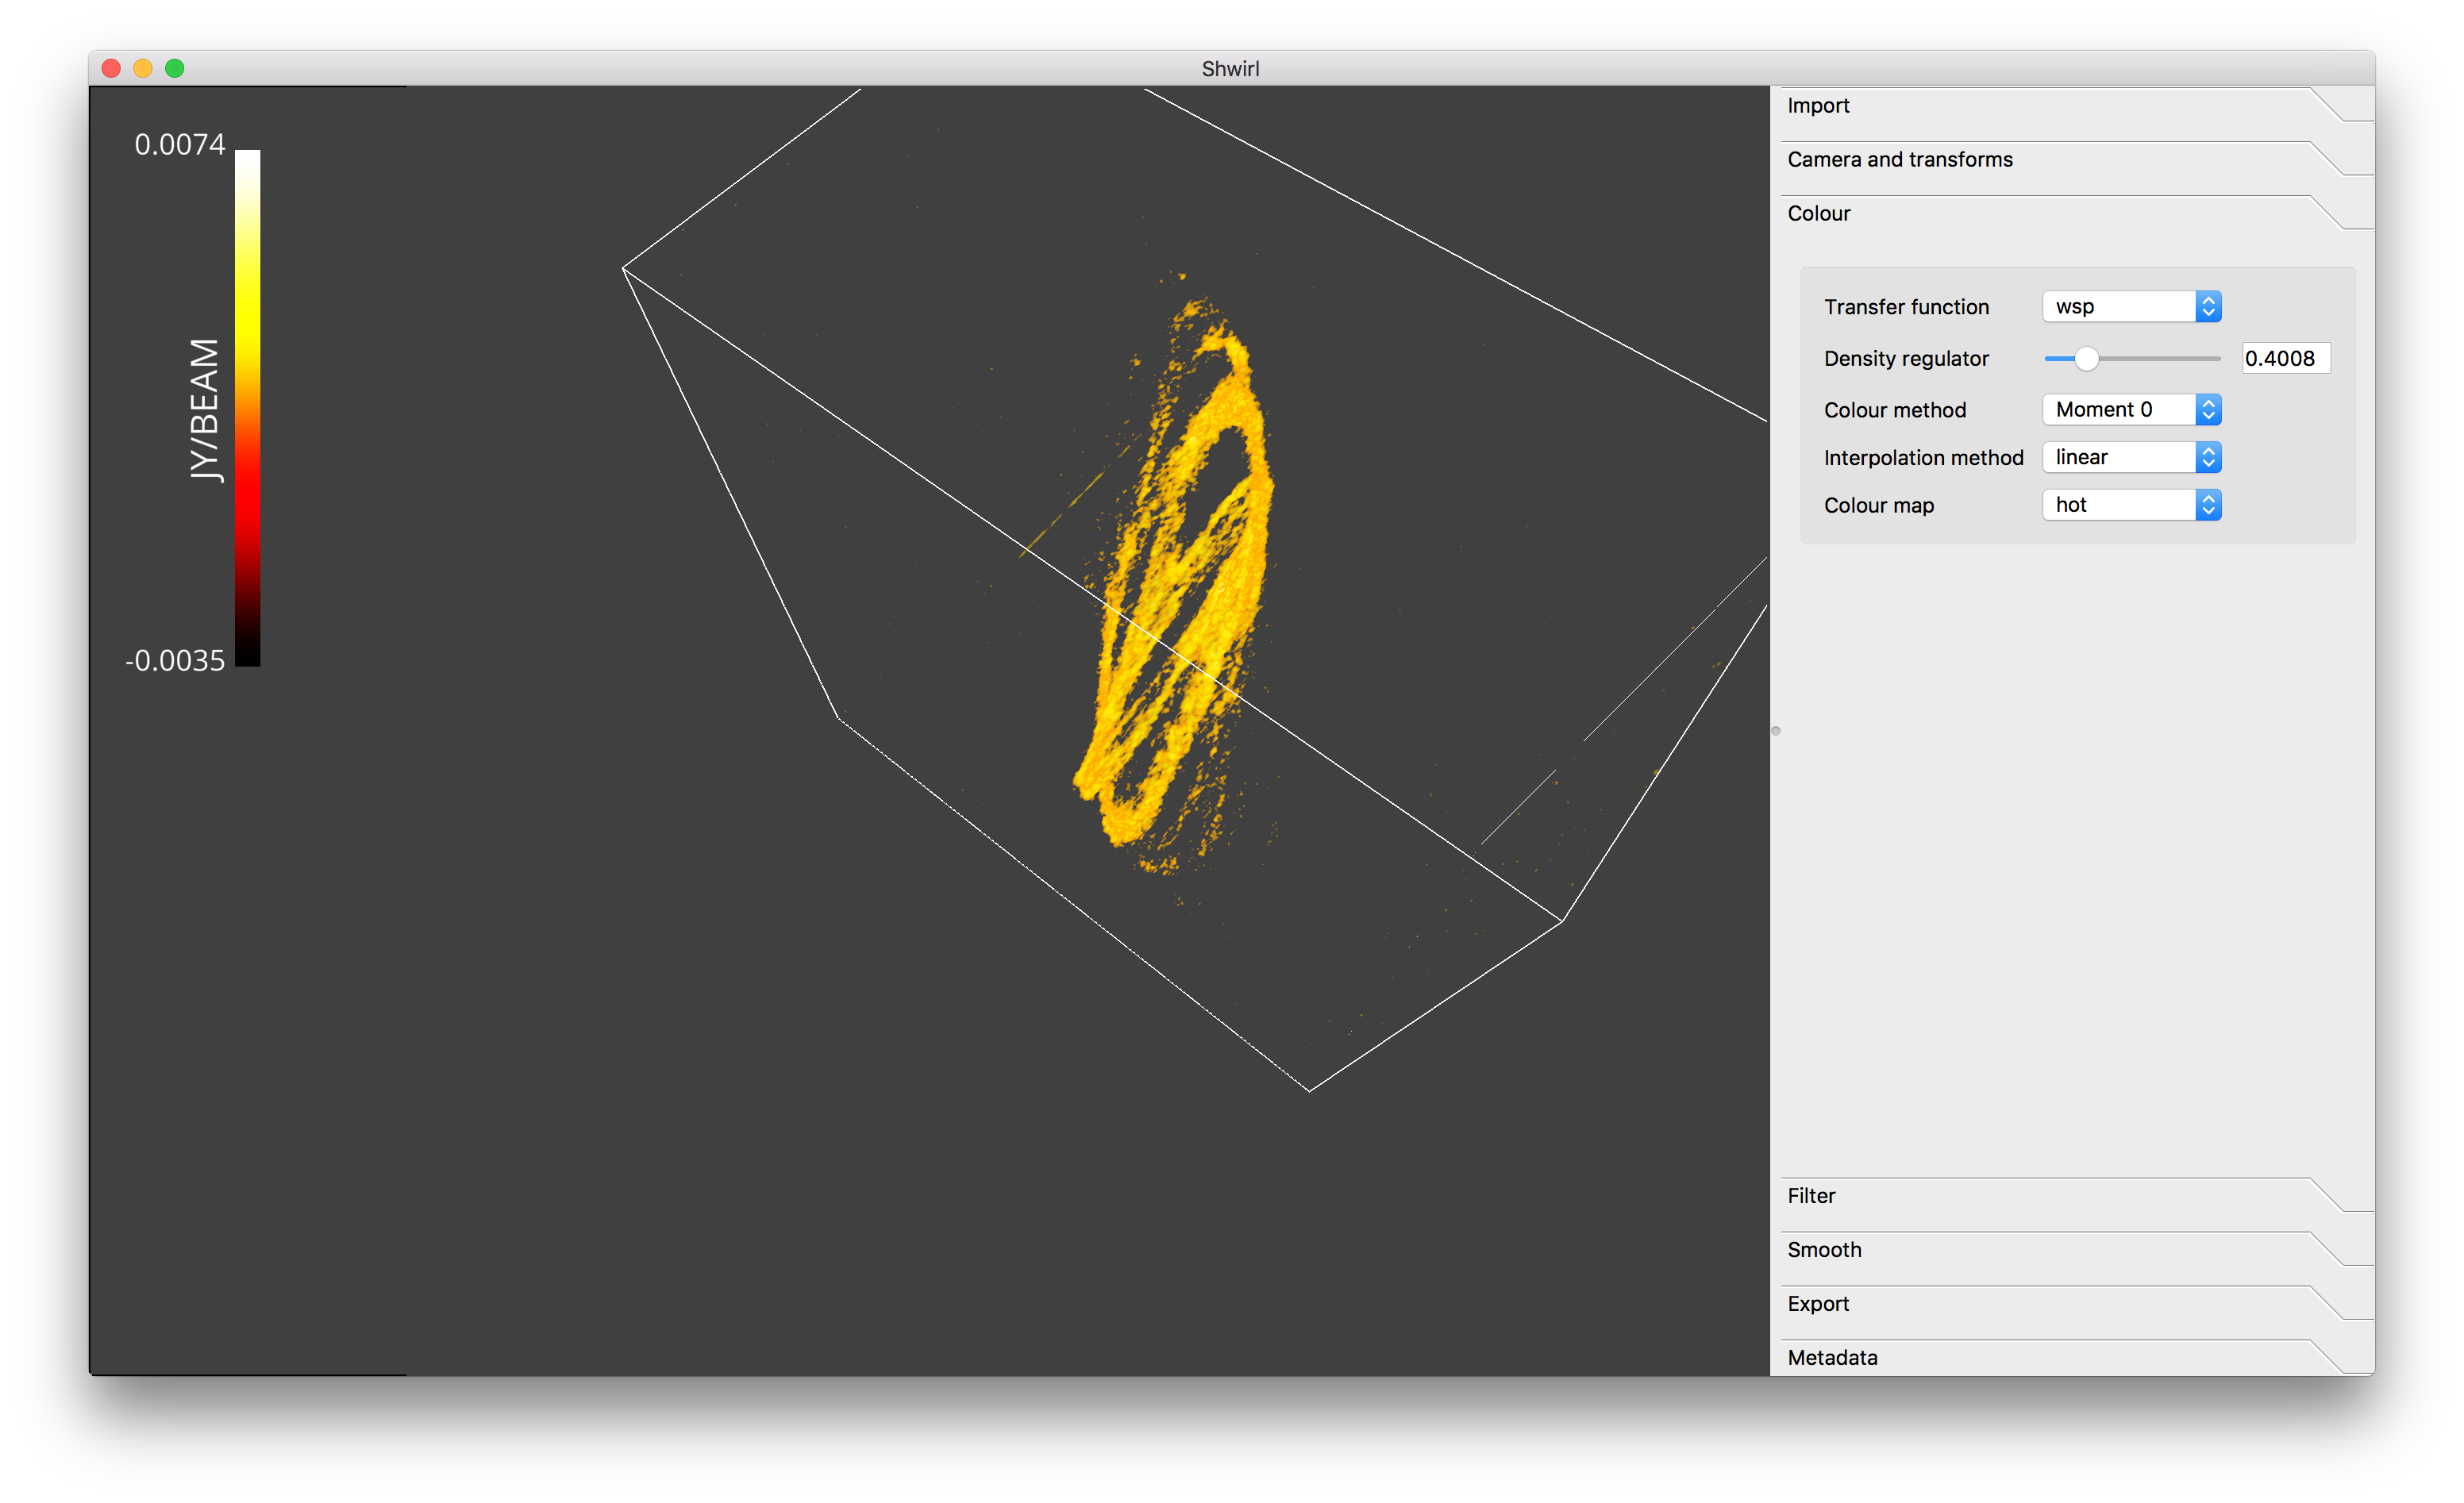
- Moment 0 (maps voxel intensity to colour)
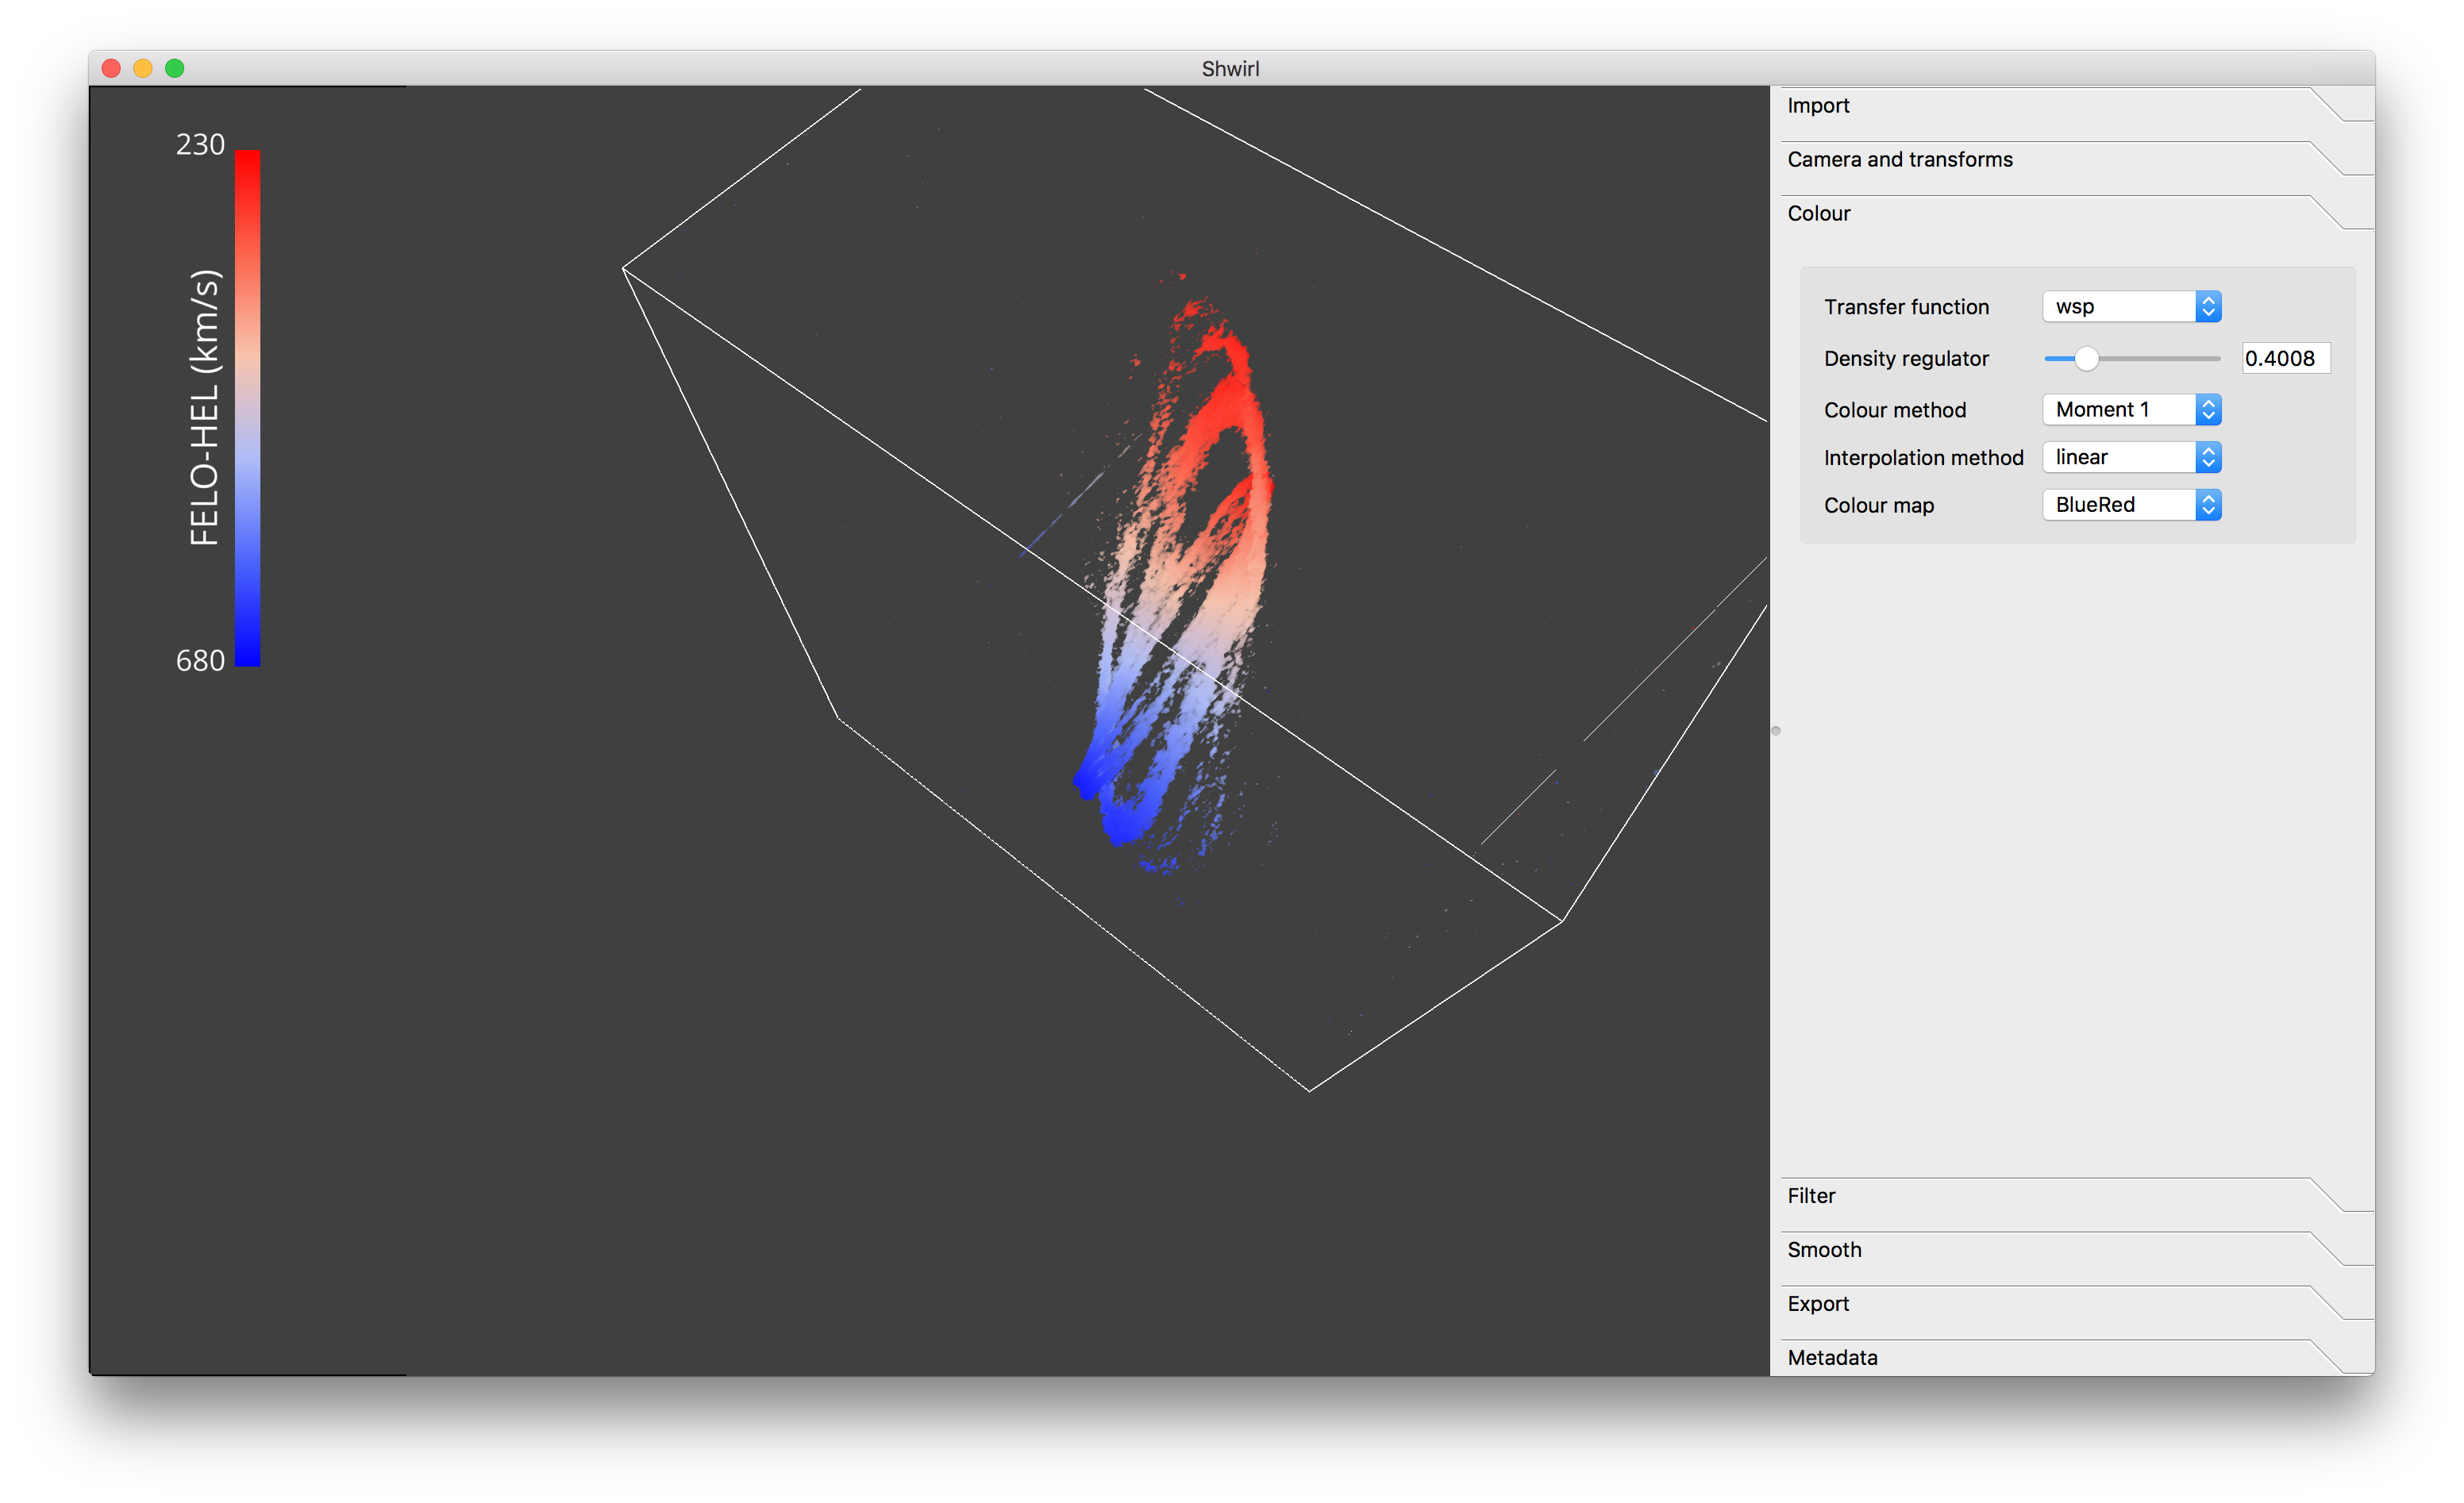
- Moment 1 (maps velocity to colour and voxel intensity to transparency)
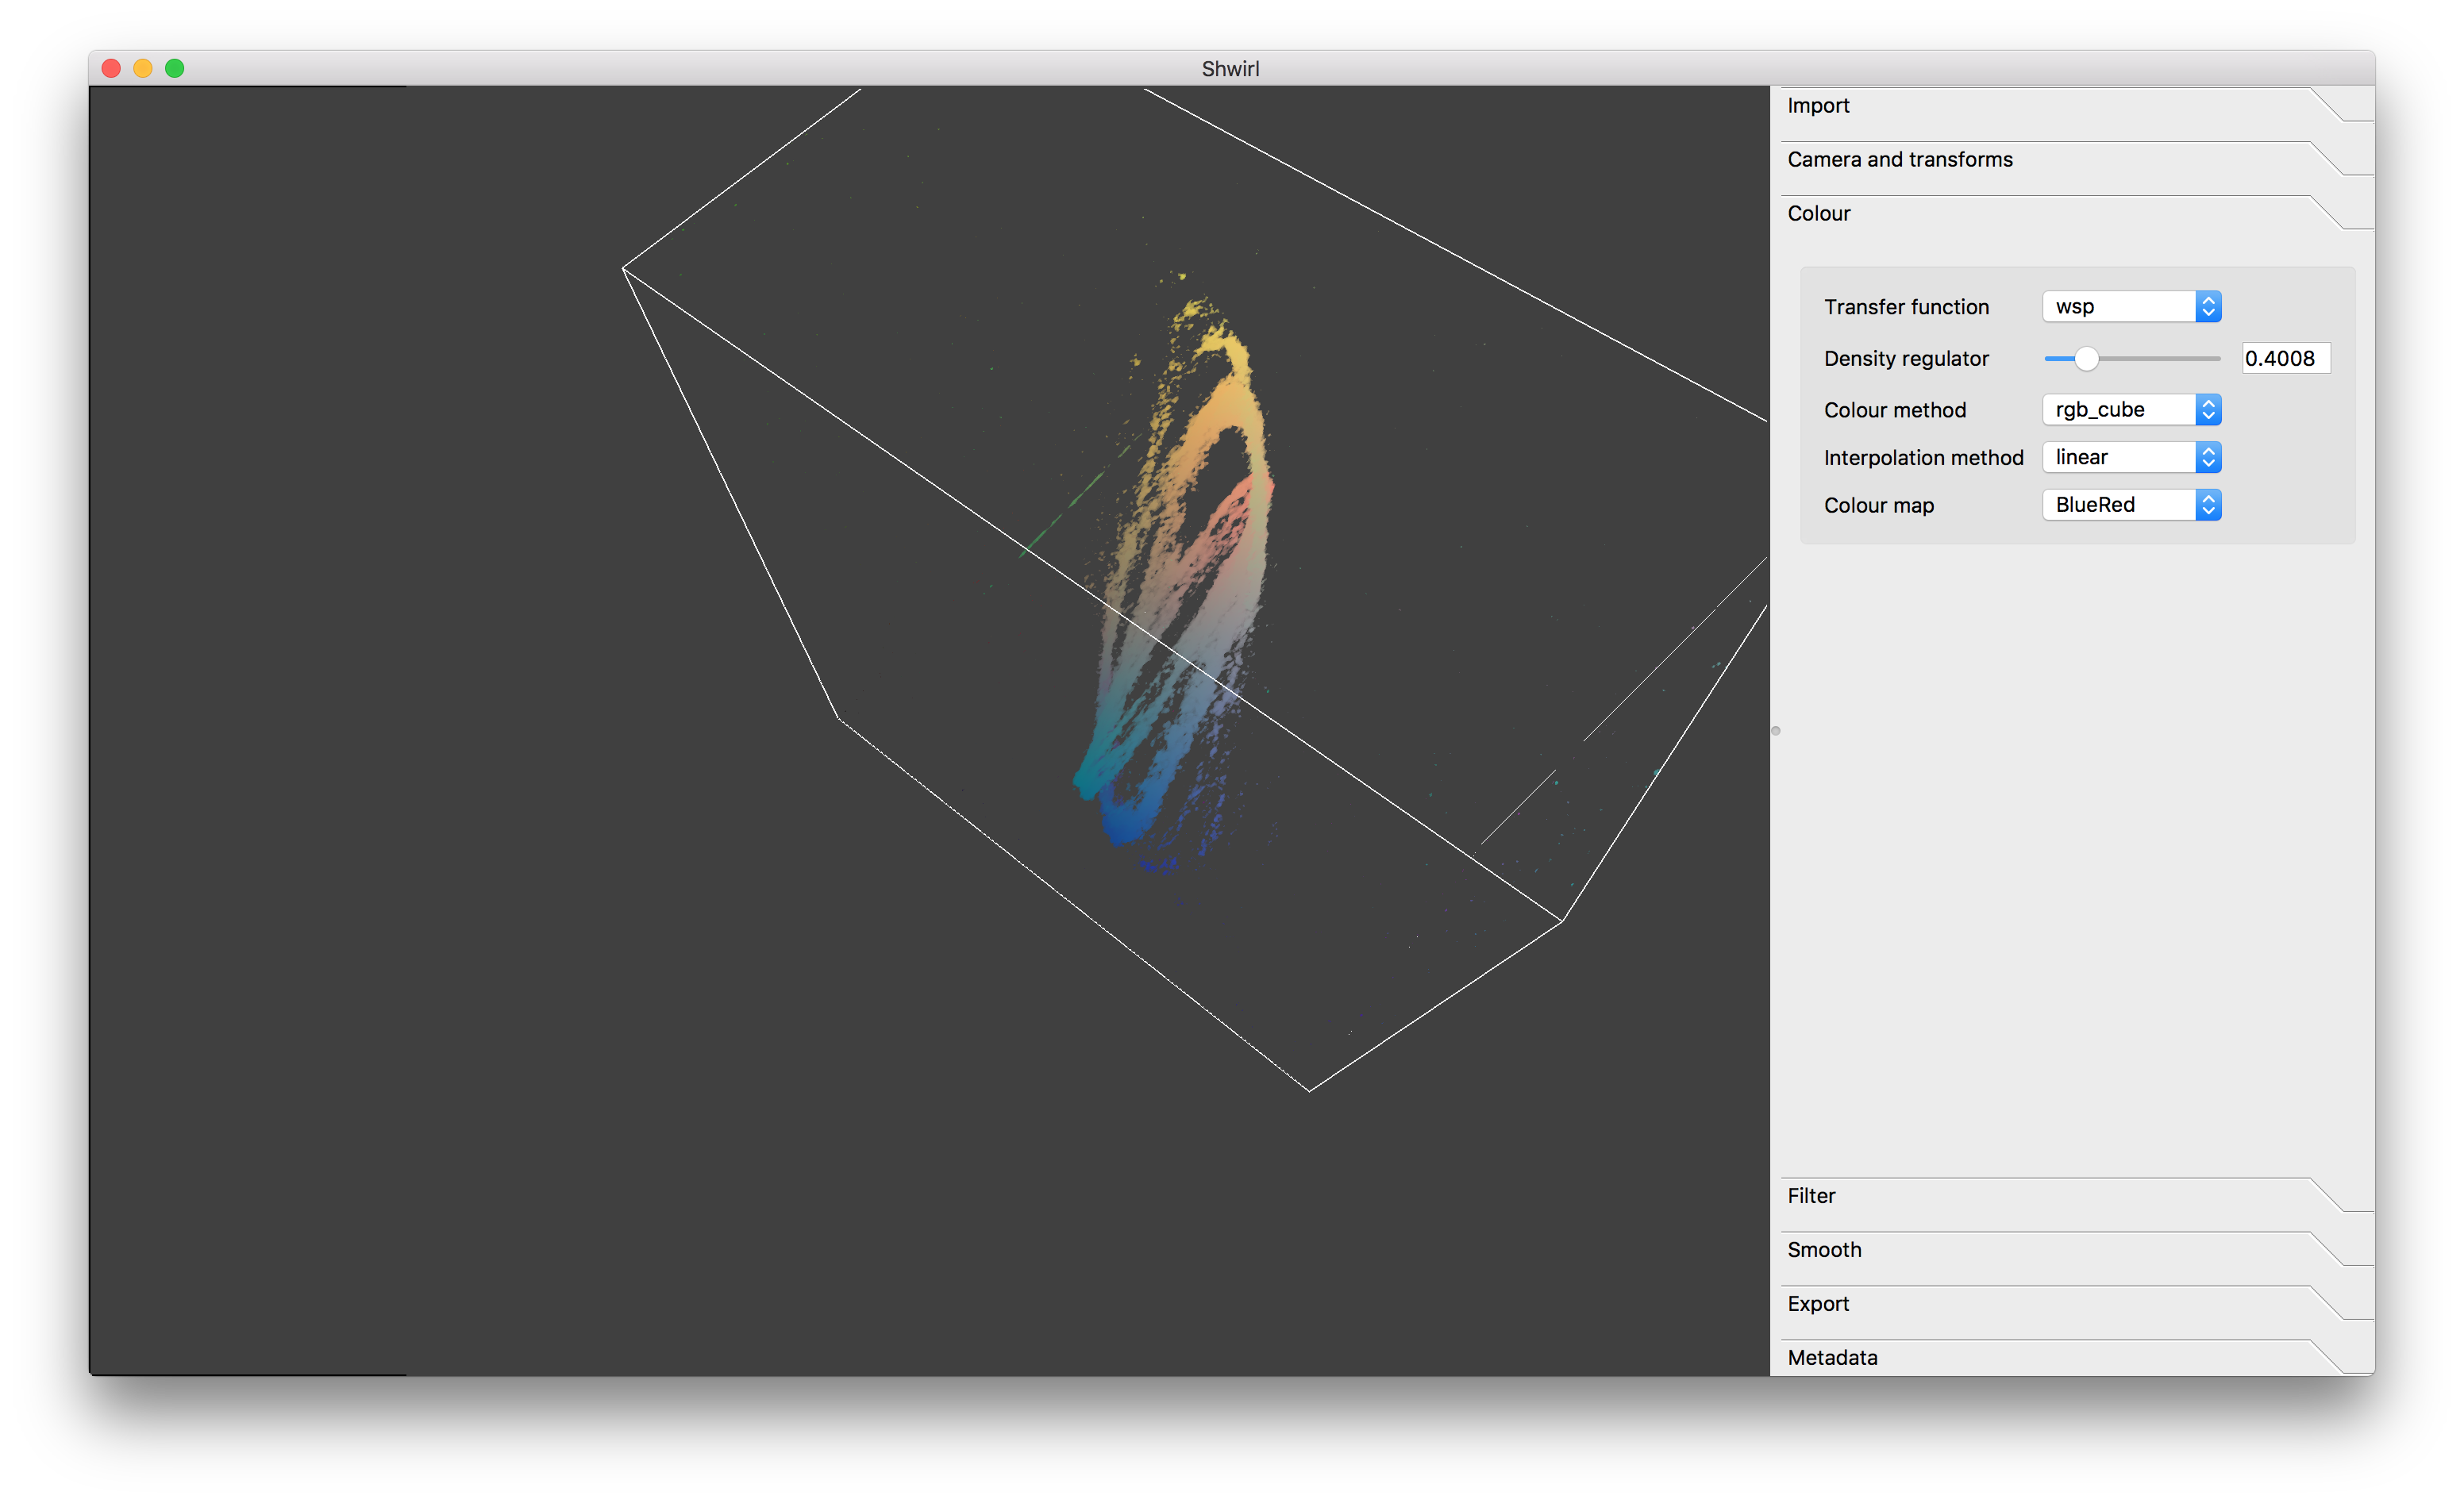
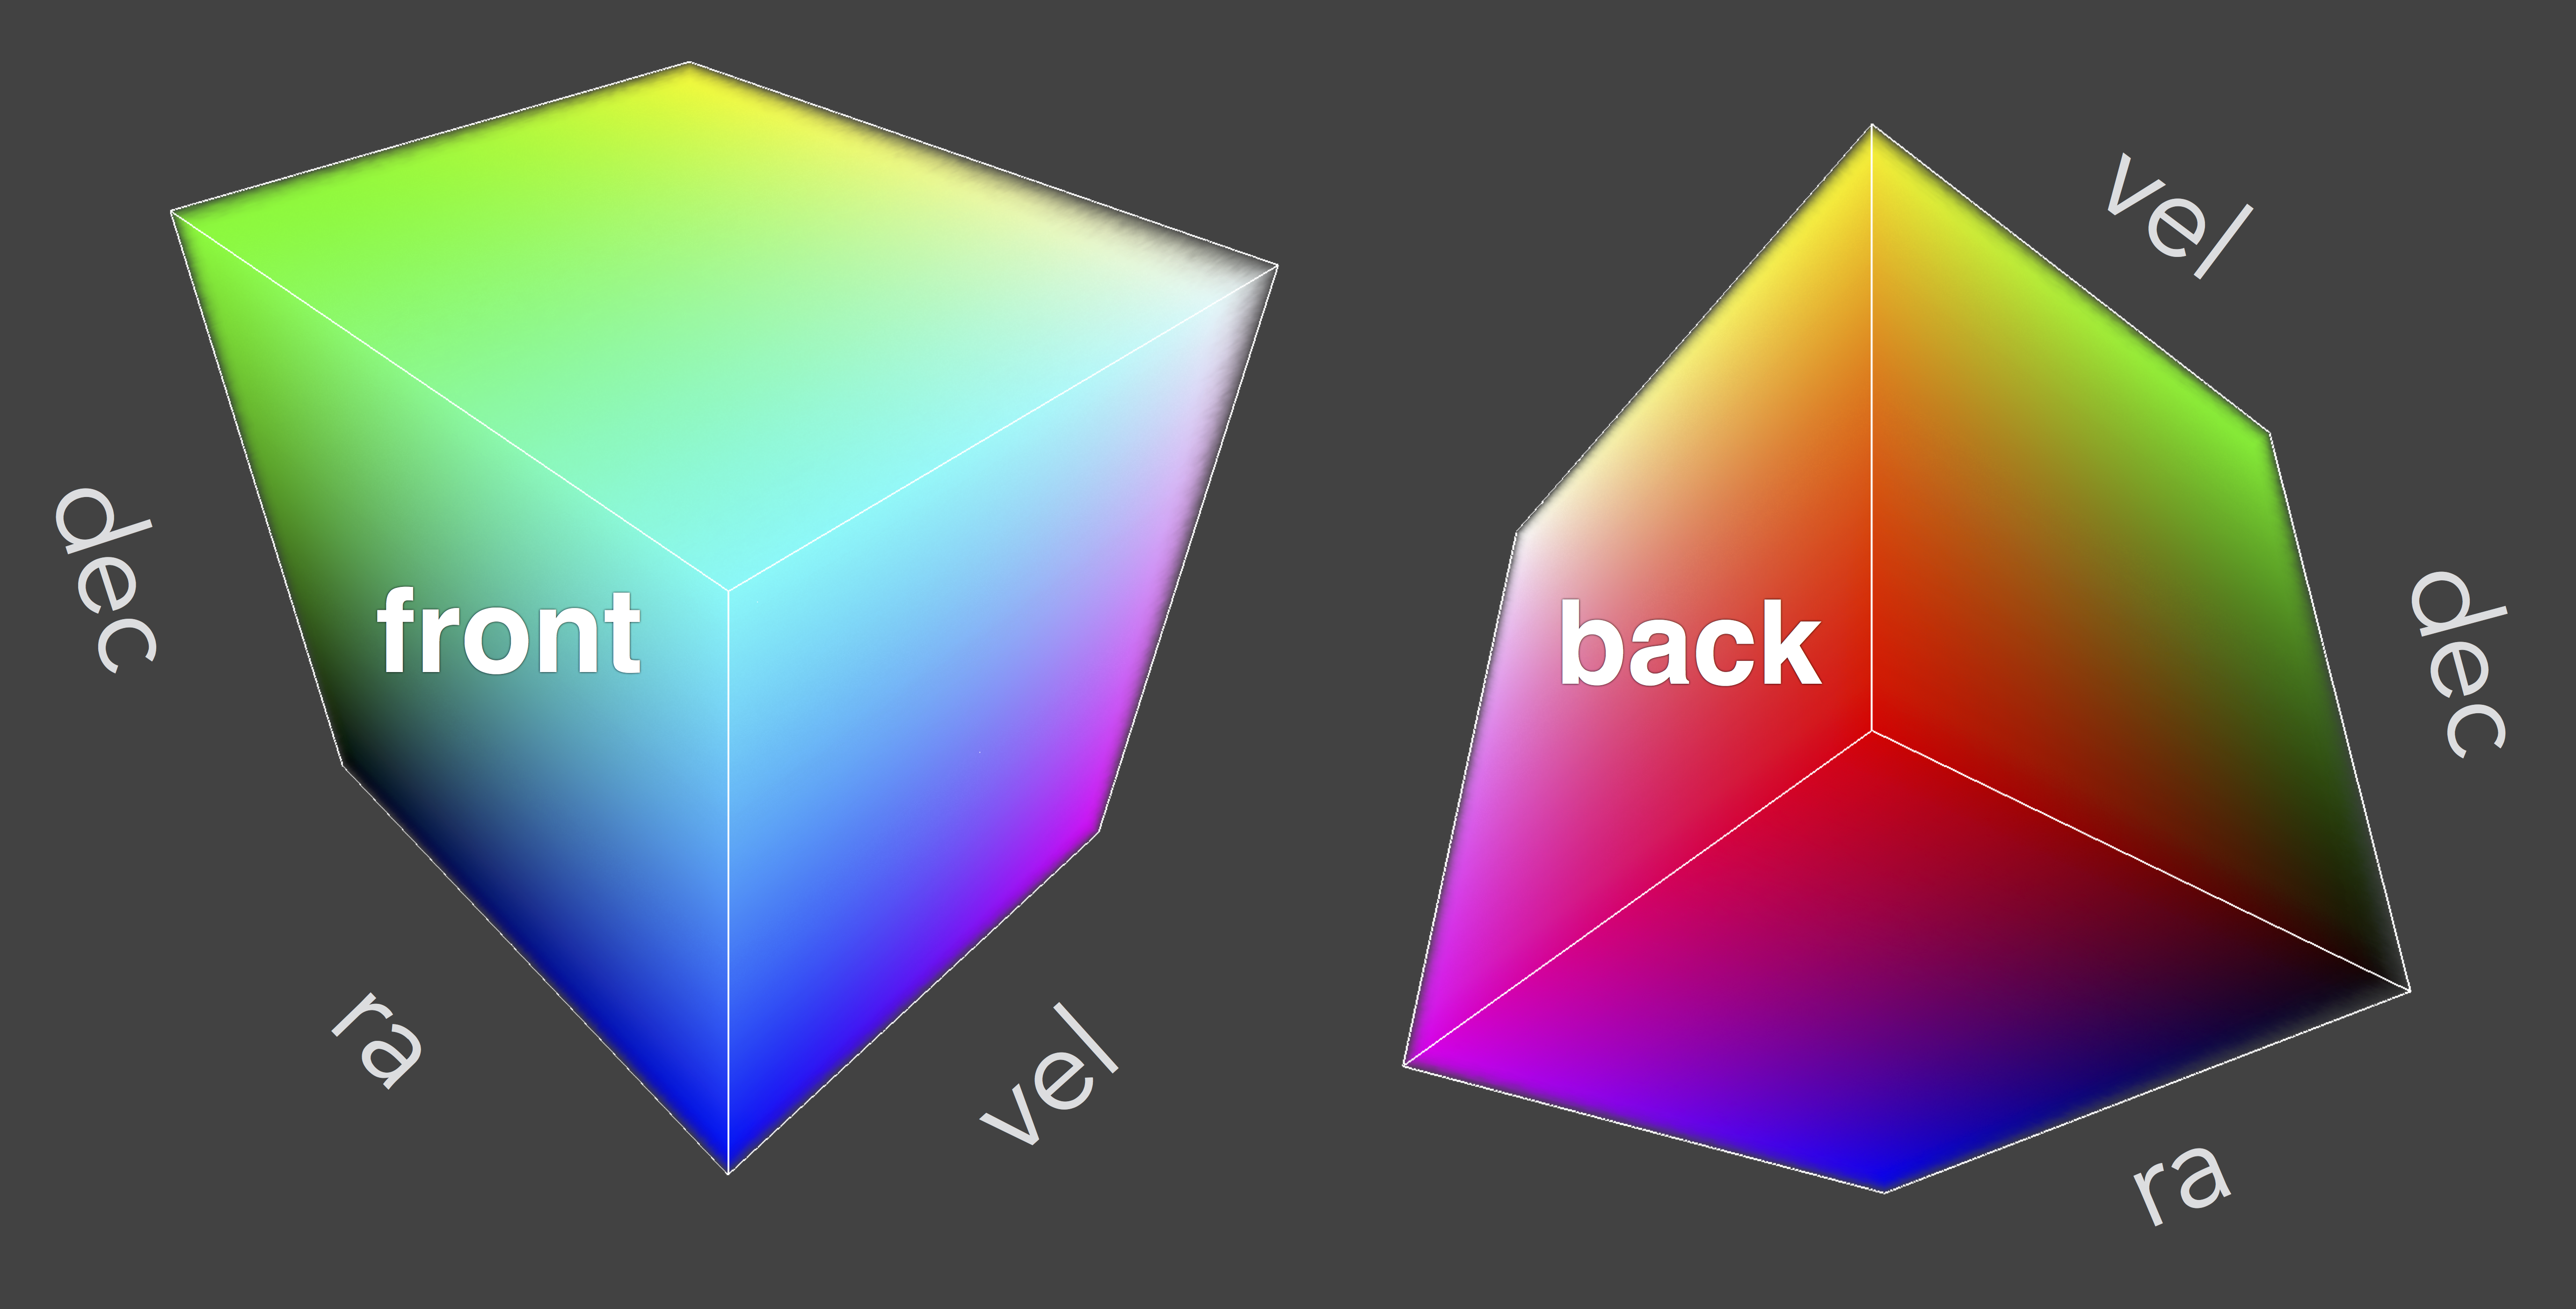
- RGB cube (maps voxel xyz position to rgb, and voxel intensity to transparency)
Example of AVIP + Moment 0:
Example of AVIP + Moment 1:
Example of AVIP + RGB cube:
MIP is used in the other examples.
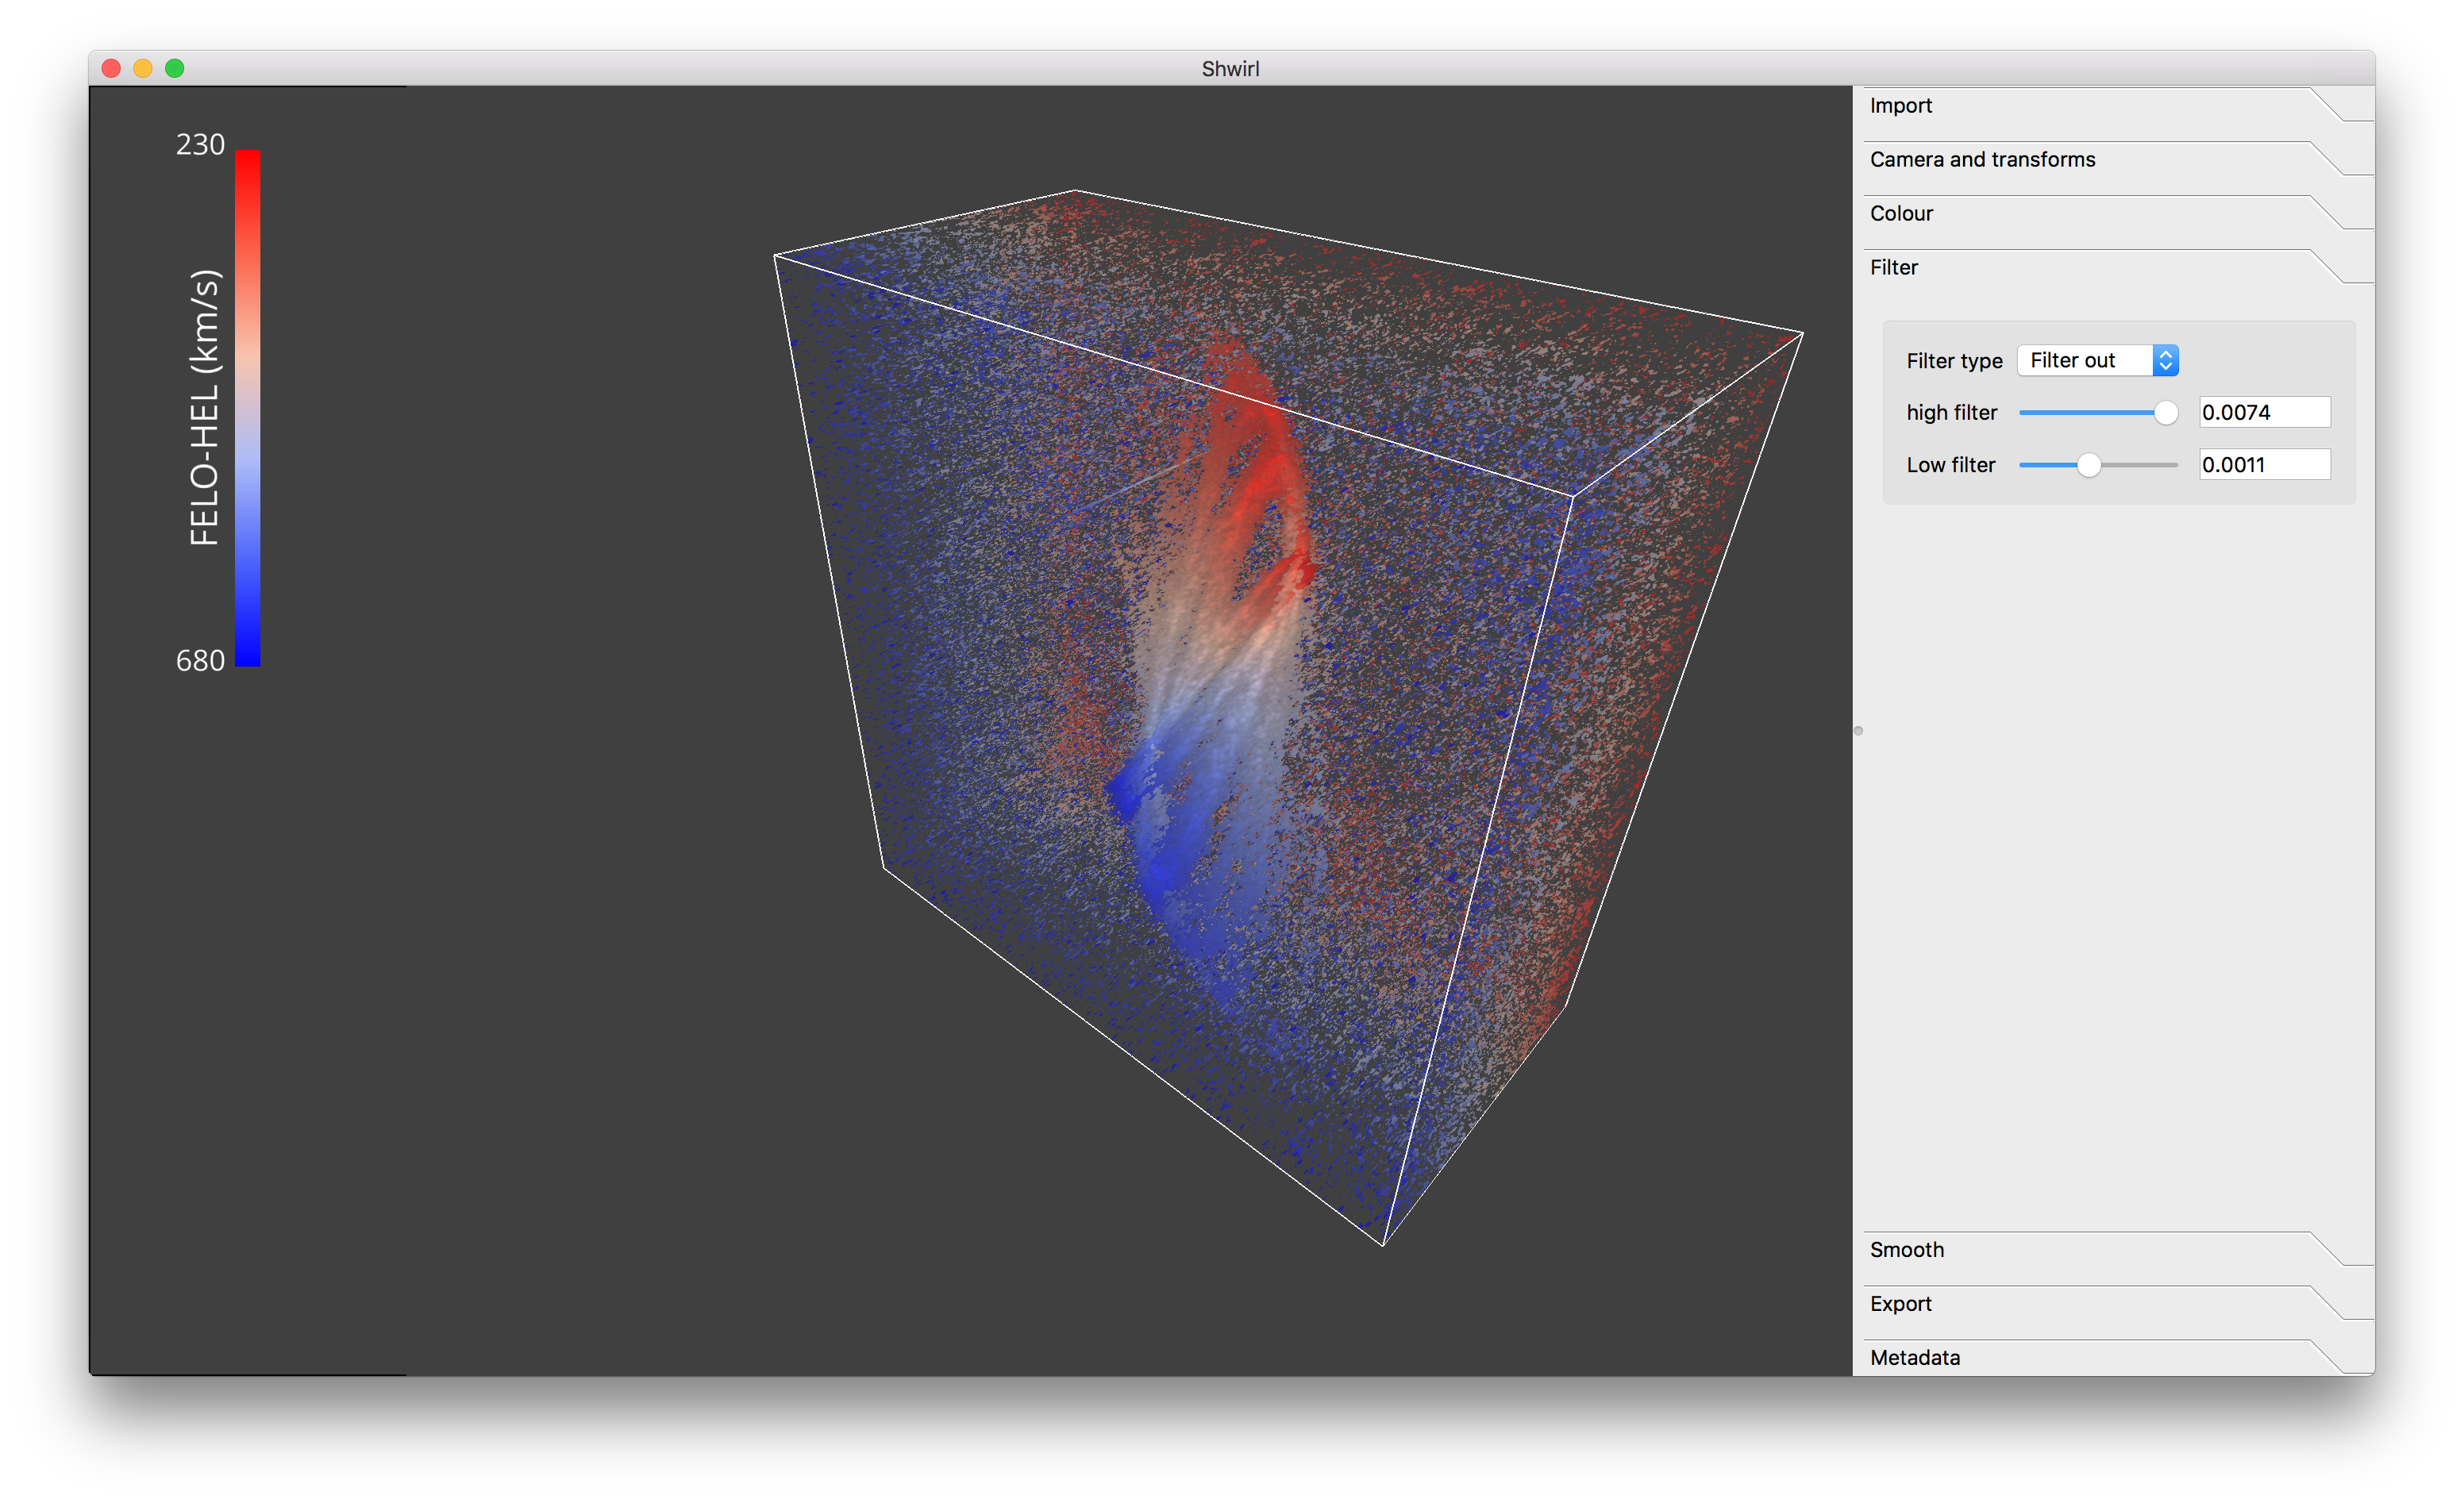
Filter
- Intensity clipping (Filter out)
- Intensity domain scaling (Rescale)
No Filter:
Intensity clipping:
Computing an emission line ratio in 3D space
The functionalities to compute an emission line ratio can currently be found in the dev branch on github. See Vohl, Fluke, Barnes & Hassan (2017) for more details. More to come soon.
Axis labels
Axis labels are currently under development. Coming soon.